Opportunities & Roadmap
Ranked improvement opportunities and phased transformation plans.
Opportunities
The Opportunities tab delivers a ranked list of improvement opportunities derived from all documented processes. Each opportunity includes:
- Type (Automation, standardization, integration, error reduction, or optimization).
- Hours per week saved and FTEs involved.
- Estimated annual savings based on your configured labor rate.
- Time to value (how long implementation would take).
- Policy and Readiness columns (covered below) once those checks have run.
The dashboard columns are: #, Opportunity, Type, Policy, Readiness, hrs/wk, FTEs, Annual Savings, and Time to Value. Click any opportunity to open its dedicated full-page view.
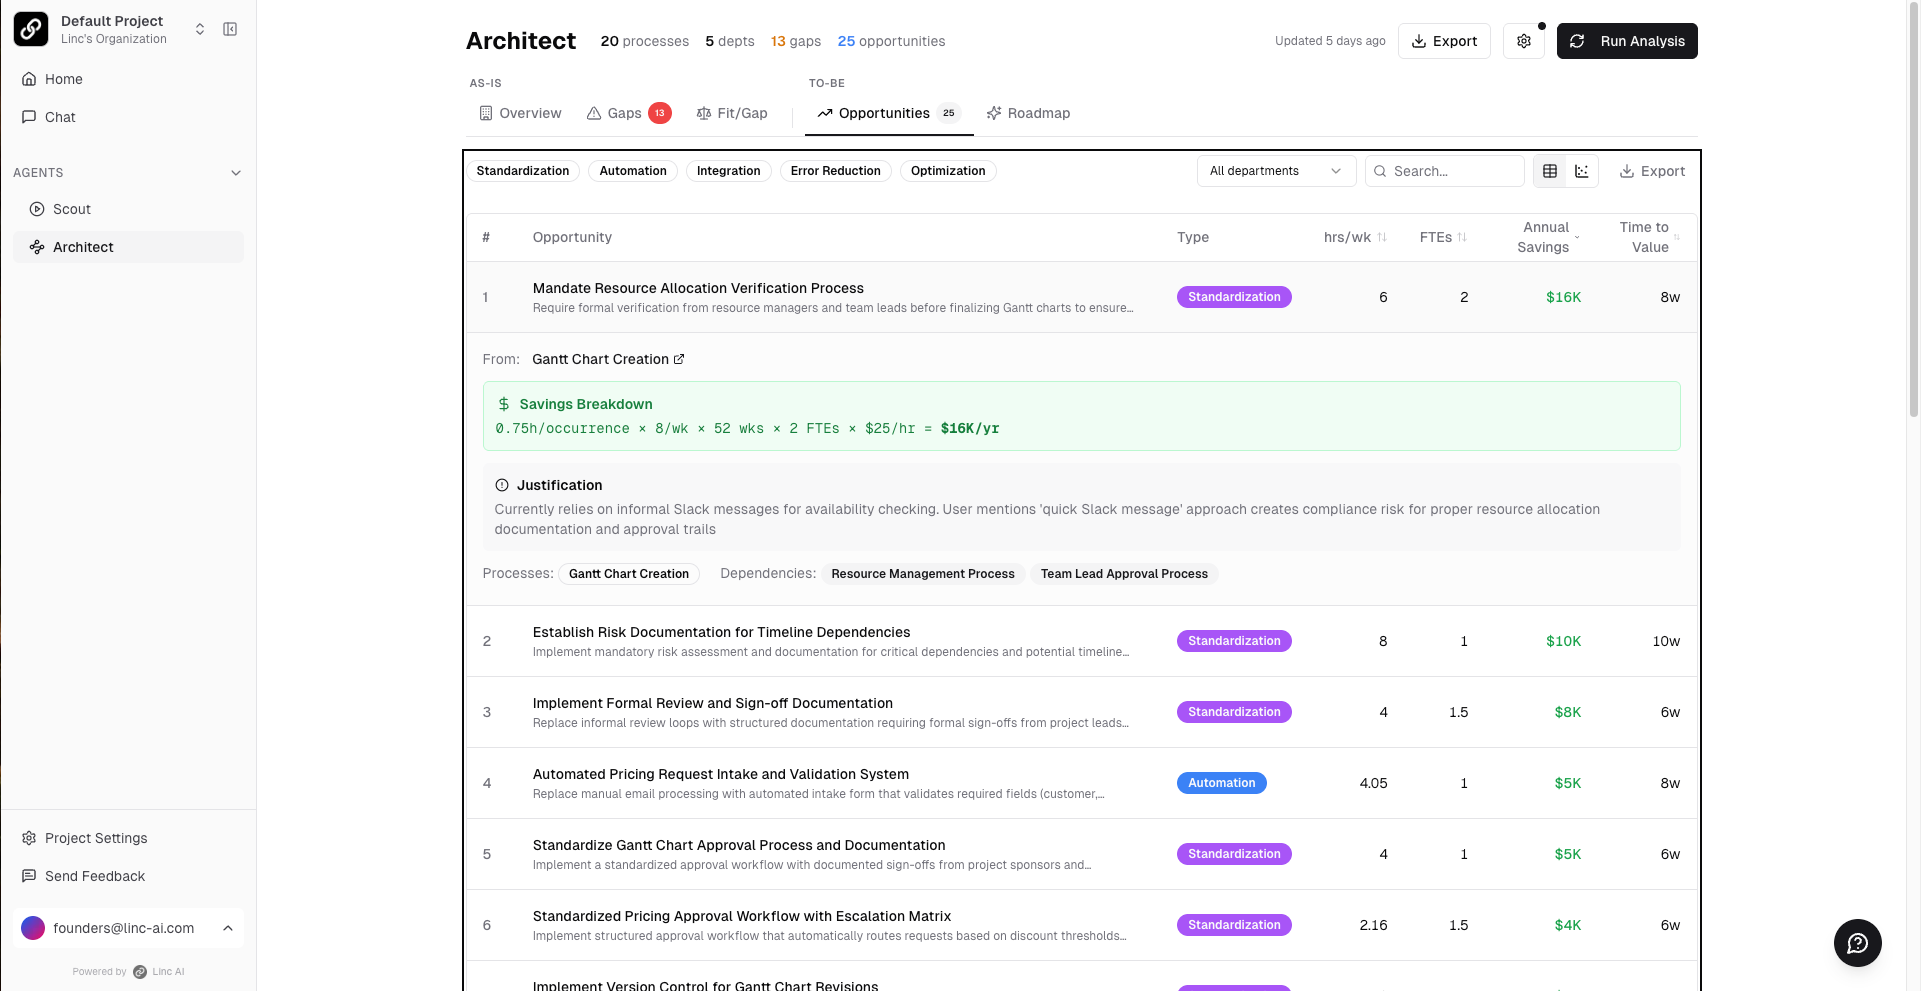
You can filter opportunities by department, view them in a graph comparing savings vs. time to value, and export the full dataset as Excel or CSV.
Opportunity Detail (Full-Page View)
Clicking an opportunity opens a dedicated full-page view with a sticky header (breadcrumb, name, type badge) and a row of tabs. The active tab is mirrored to the URL (via a ?tab= query parameter, with the Roadmap on its own route), so any tab can be deep-linked and shared.
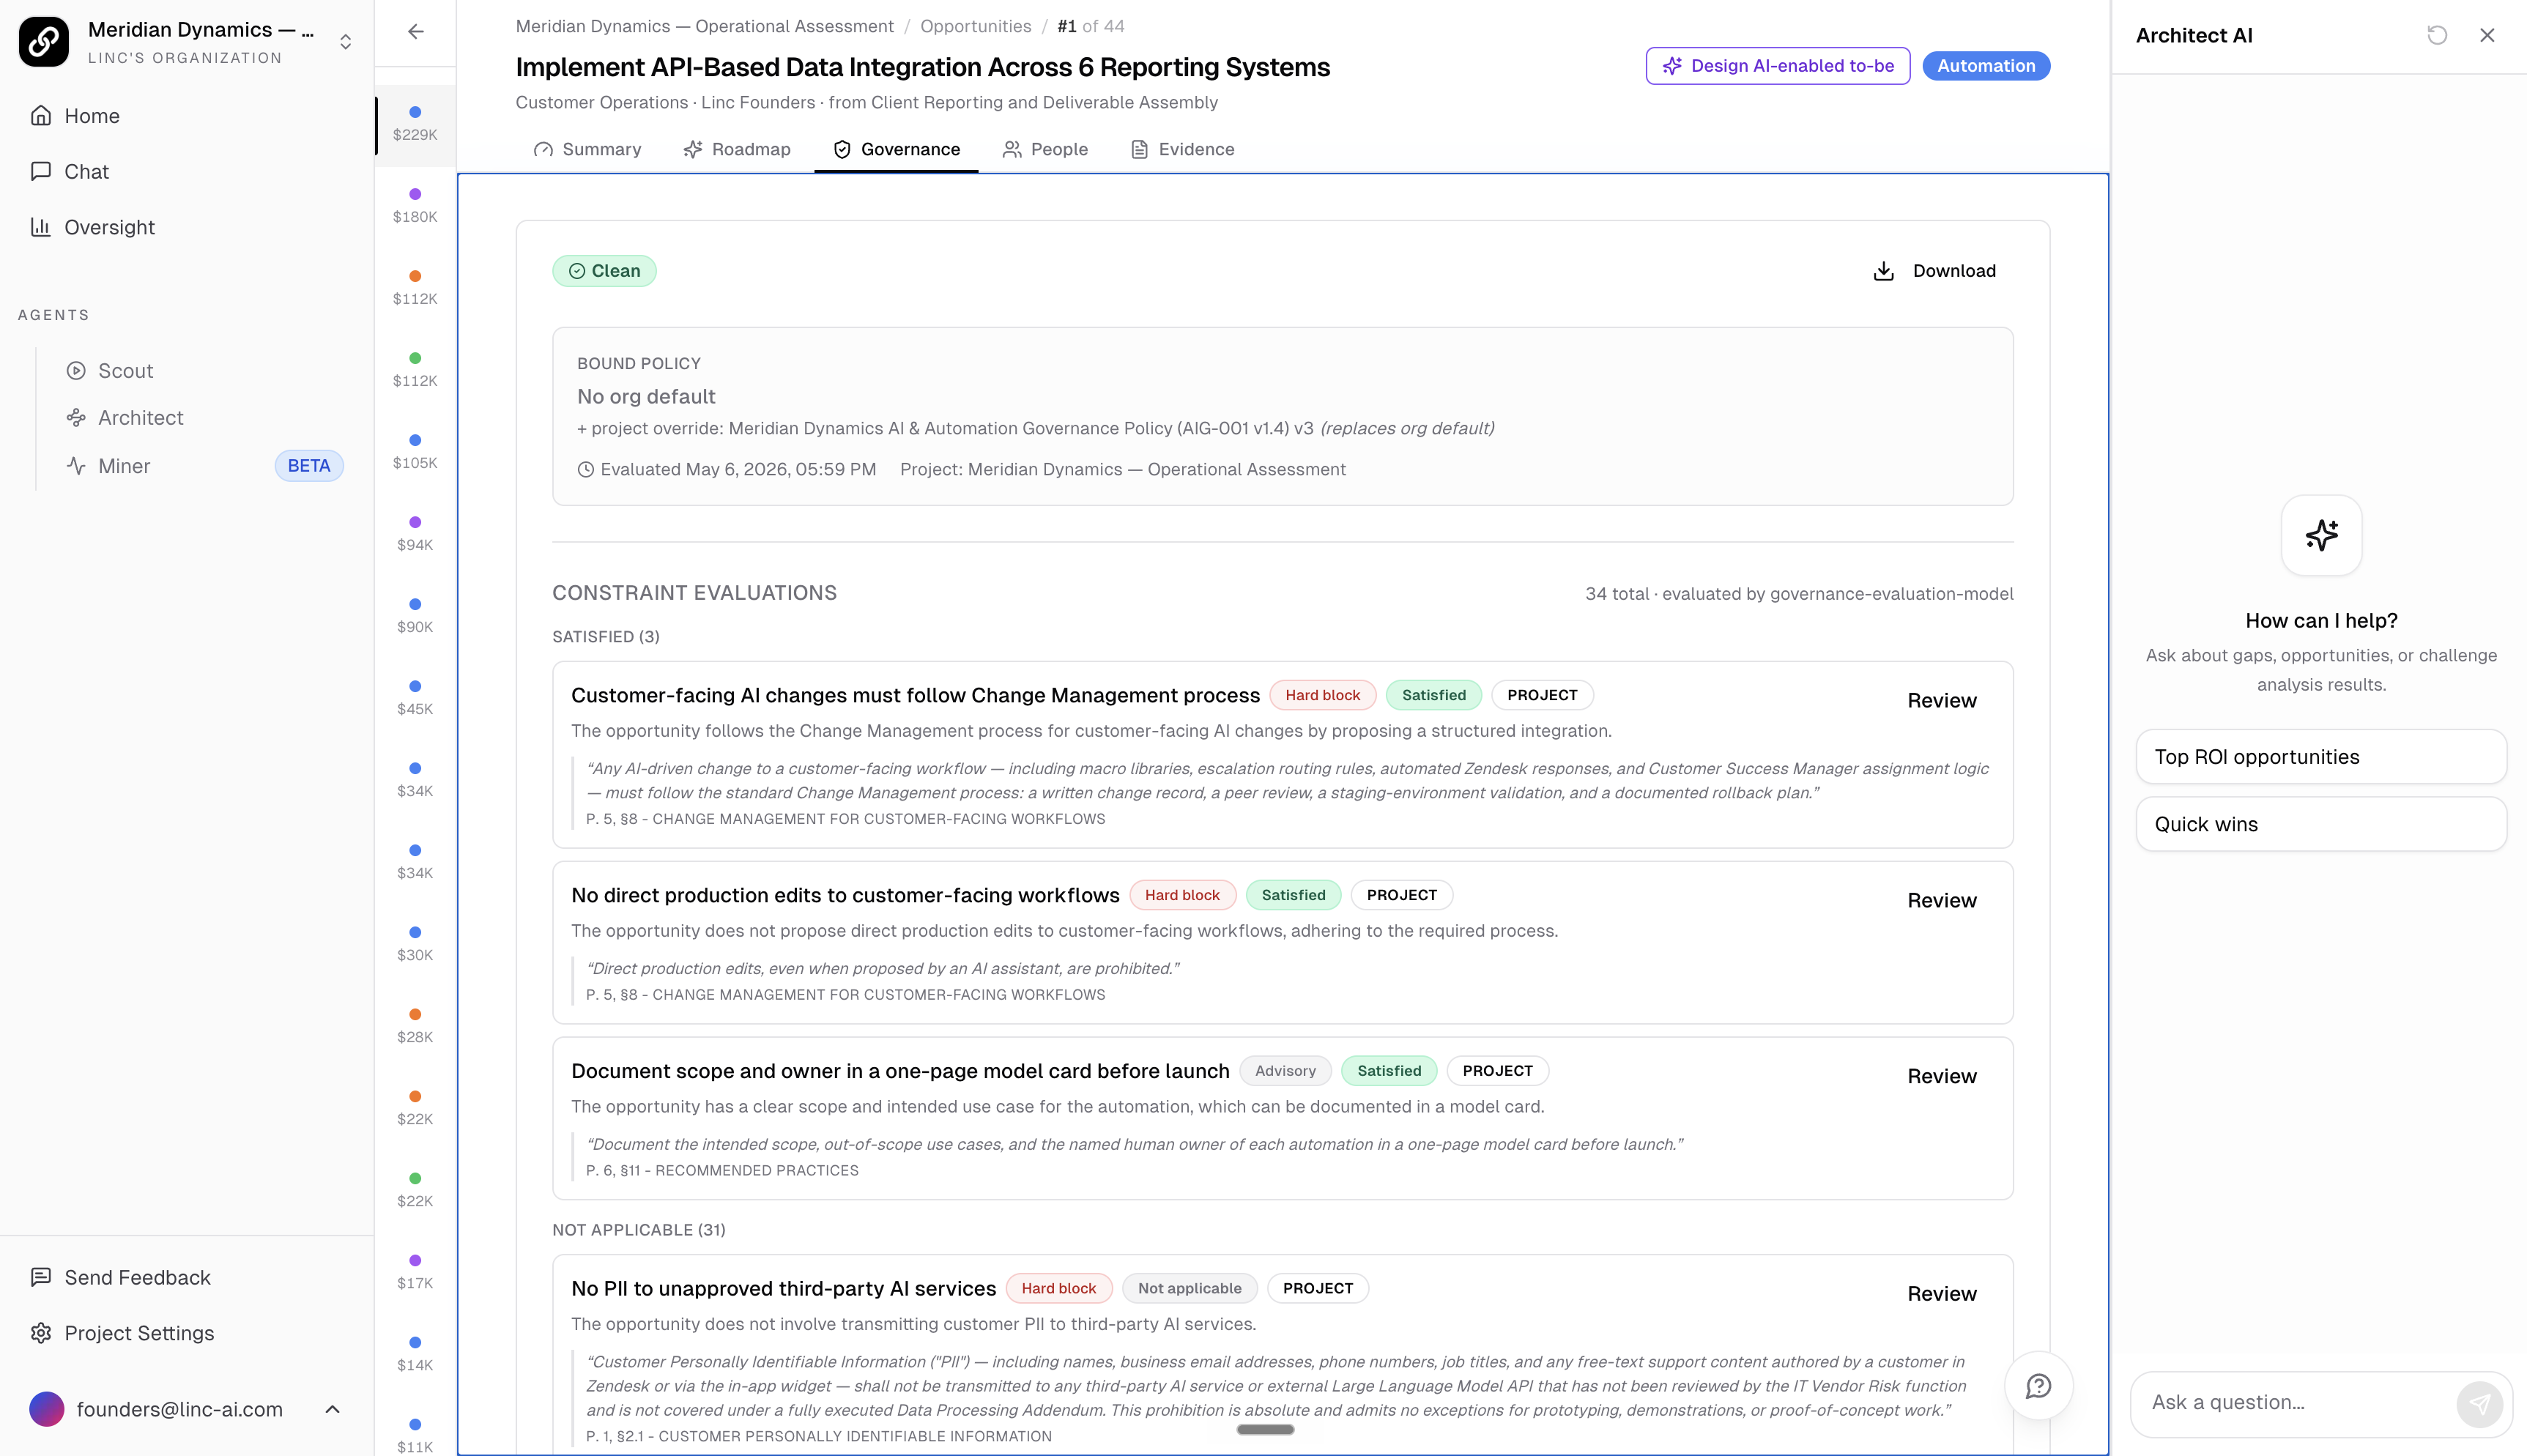
- Summary (a KPI strip with Annual savings, Readiness, and Governance cards, the opportunity rationale and details, plus the Pilot to Scale readiness scorecard inline).
- Roadmap (the phased transformation plan with inline ROI math, including implementation cost, timeline, and estimated payback).
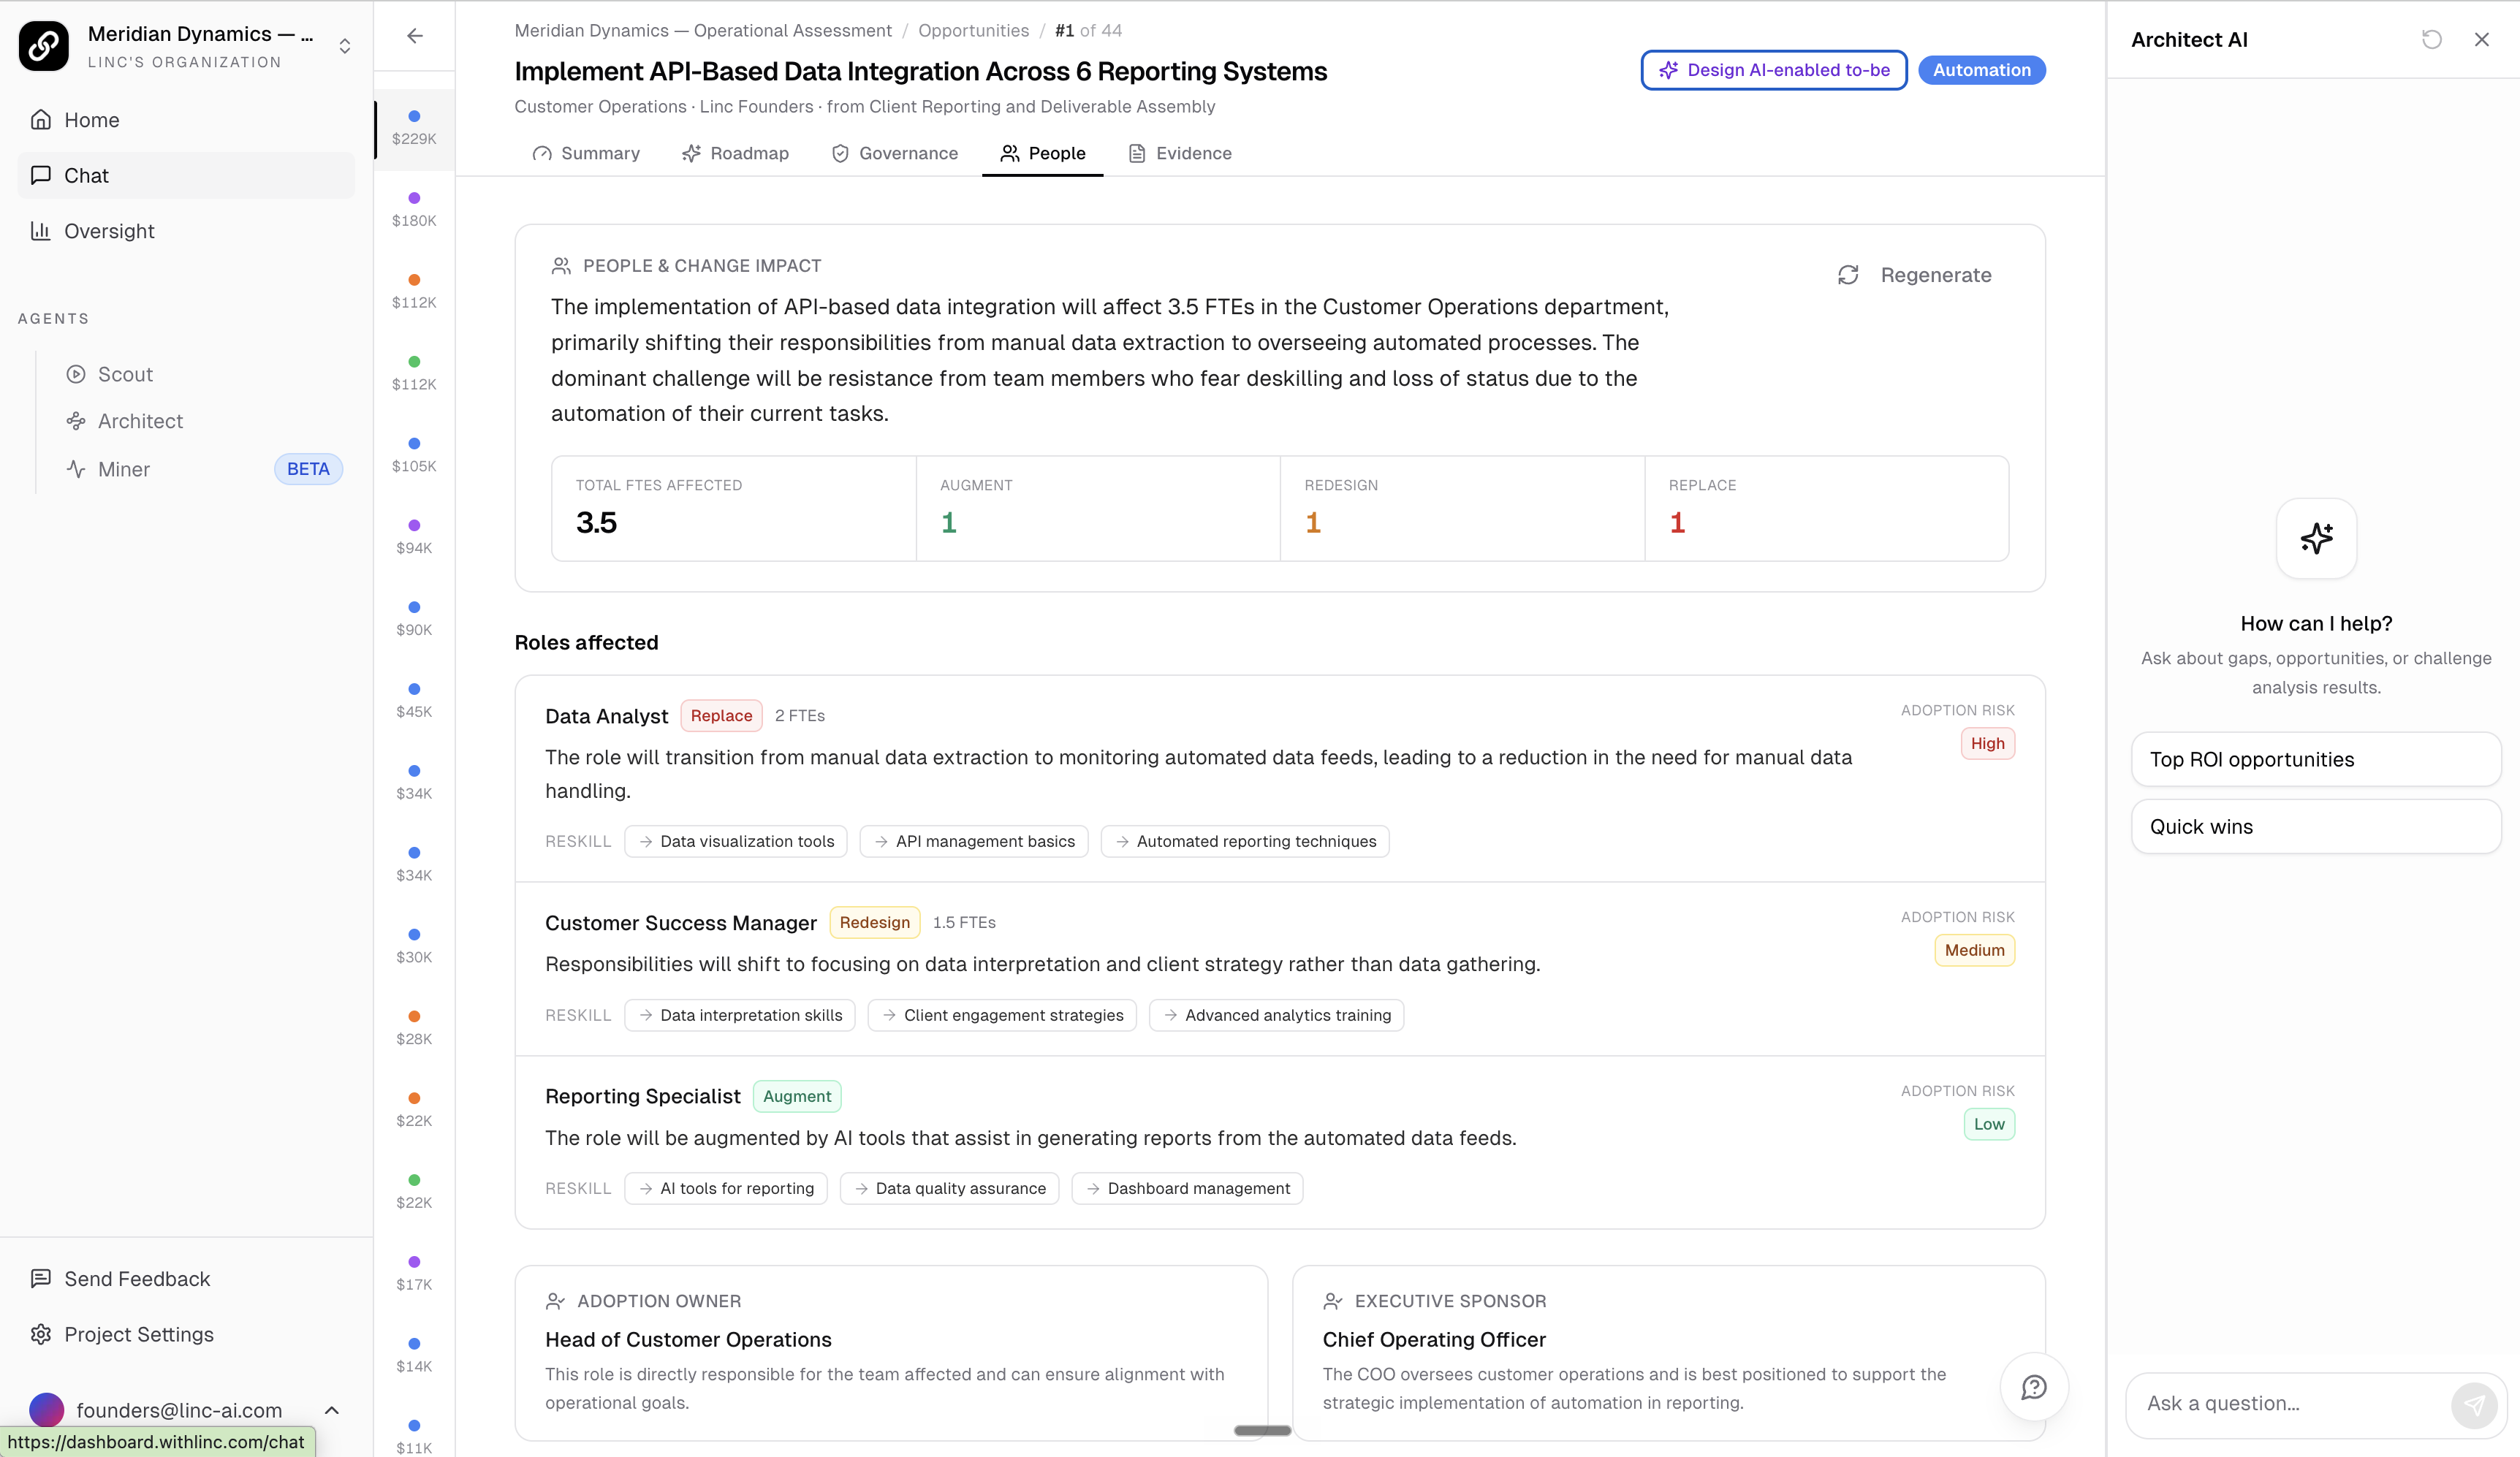
- Governance (the governance receipt for automation-type opportunities).
- People (the People and Change-Management Impact assessment).
- Evidence (transcript observations, SOP excerpts, linked processes, and the source interview).
Readiness
Pilot to Scale Readiness is a per-opportunity scorecard computed on demand from signals already in the system (governance traces, opportunity fields, roadmap state). It scores four dimensions, shown as a radar plus a detail panel:
- Governance posture
- Data readiness
- Change management
- Pilot evidence
Each dimension shows a 0-100 score and the top recommendation that would move it up. The overall score rolls into a disposition (Ready, Hold, or Not ready) against a go threshold. The scorecard renders inline on the Summary tab, and a Readiness column plus a per-row action on the dashboard let you run or re-run the check across the run.
People Impact
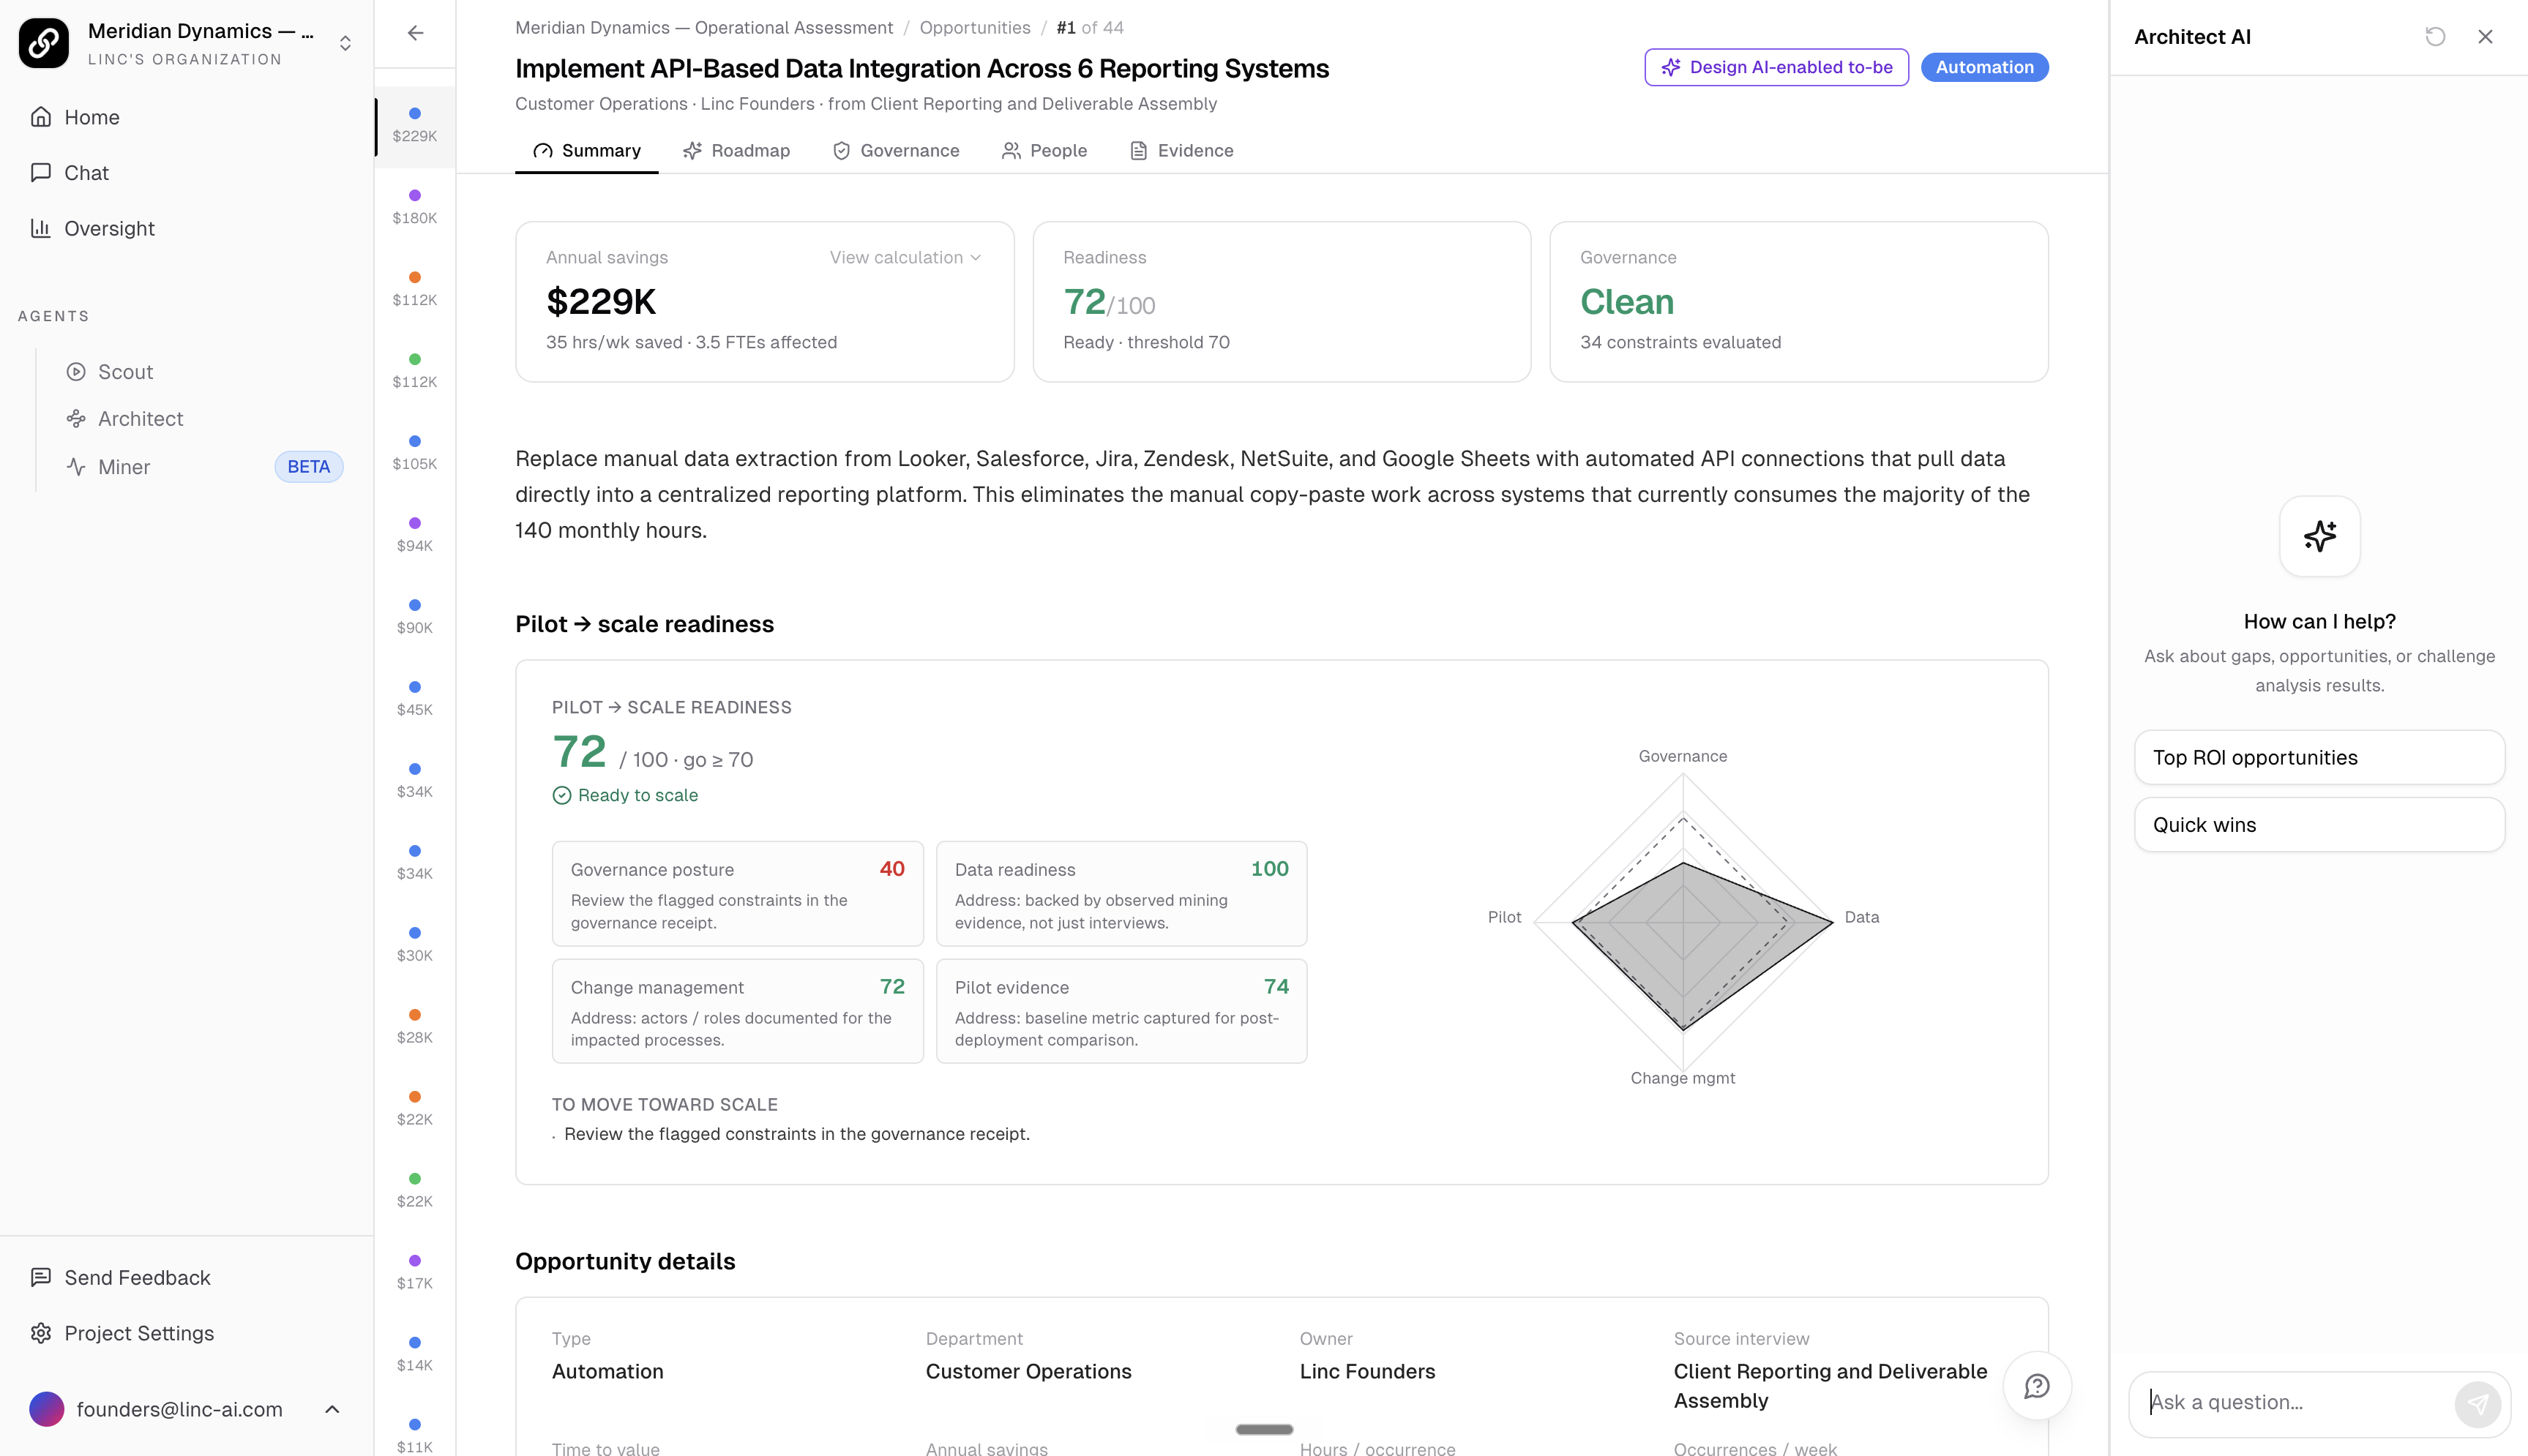
The People tab generates a People and Change-Management Impact assessment for the opportunity. It is auto-derived from the opportunity description, processes involved, and FTE exposure, and is meant as a starting point for an HR conversation rather than a system of record. It covers:
- Roles affected with an augment, replace, or redesign disposition and per-role FTE estimates.
- Retraining / reskill needs per role and an adoption-risk rating.
- Suggested adoption owner and executive sponsor, each with a rationale.
- Change-management risks, each with a severity and a mitigation.
- An AI literacy and training program.
A headline strip summarizes total FTEs affected and the augment / redesign / replace mix. Use Regenerate to recompute the assessment.
Evidence
The Evidence tab traces an opportunity back to its source. It shows verbatim transcript observations (with speaker and matched terms), SOP excerpts pulled from the source SOP (the cleaned, structured version of the interview content), linked processes with mining stats (events, cases, variants, rework rate, top activities), and a link to the source interview.
How annual savings is calculated
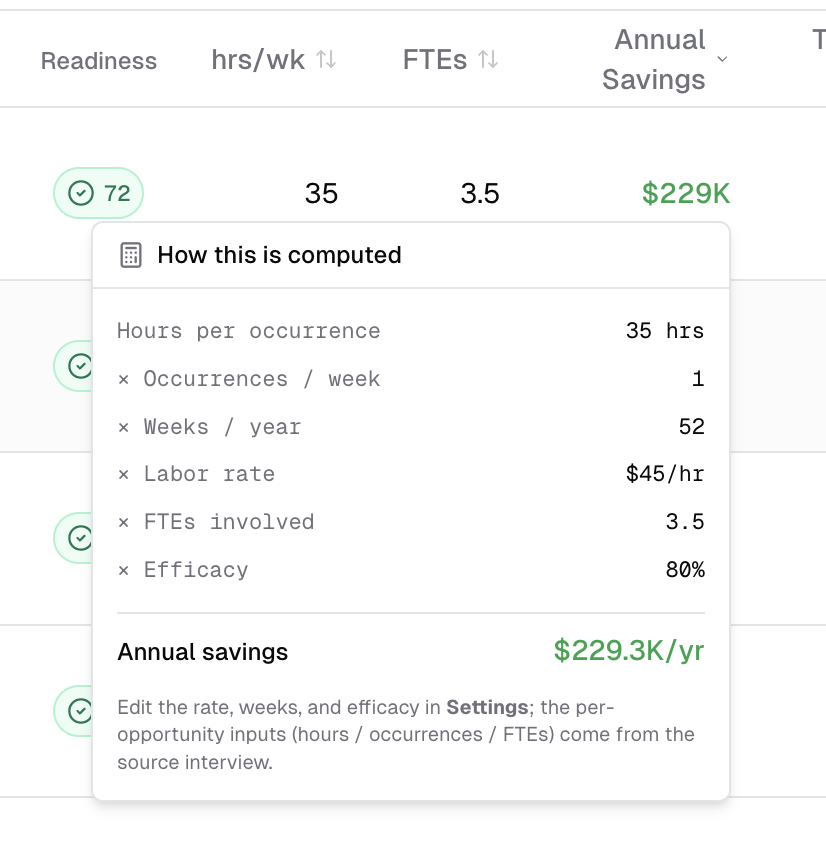
On the Summary tab, click the Annual savings KPI card to reveal how the headline figure is derived. The breakdown lists each factor in the formula and the value used:
- Hours per occurrence x occurrences per week x weeks per year x labor rate x FTEs involved x efficacy.
Hours per occurrence, occurrences per week, and FTEs involved come from the source interview for that opportunity. The labor rate, weeks per year, and efficacy come from the project's ROI assumptions, which you configure in Analysis Settings / Project Brief and which apply to every opportunity. If the labor rate is still on its default, the figure is marked as an estimate. The total is gross annual labor savings and does not subtract one-time build, integration, or change-management costs (those, and the resulting payback, are estimated in the Roadmap).
Transformation Roadmap
The Roadmap tab builds a comprehensive transformation plan based on the gap analysis and opportunities. It is organized into several sections accessible from the left sidebar within the Roadmap view.
Overview & Executive Summary
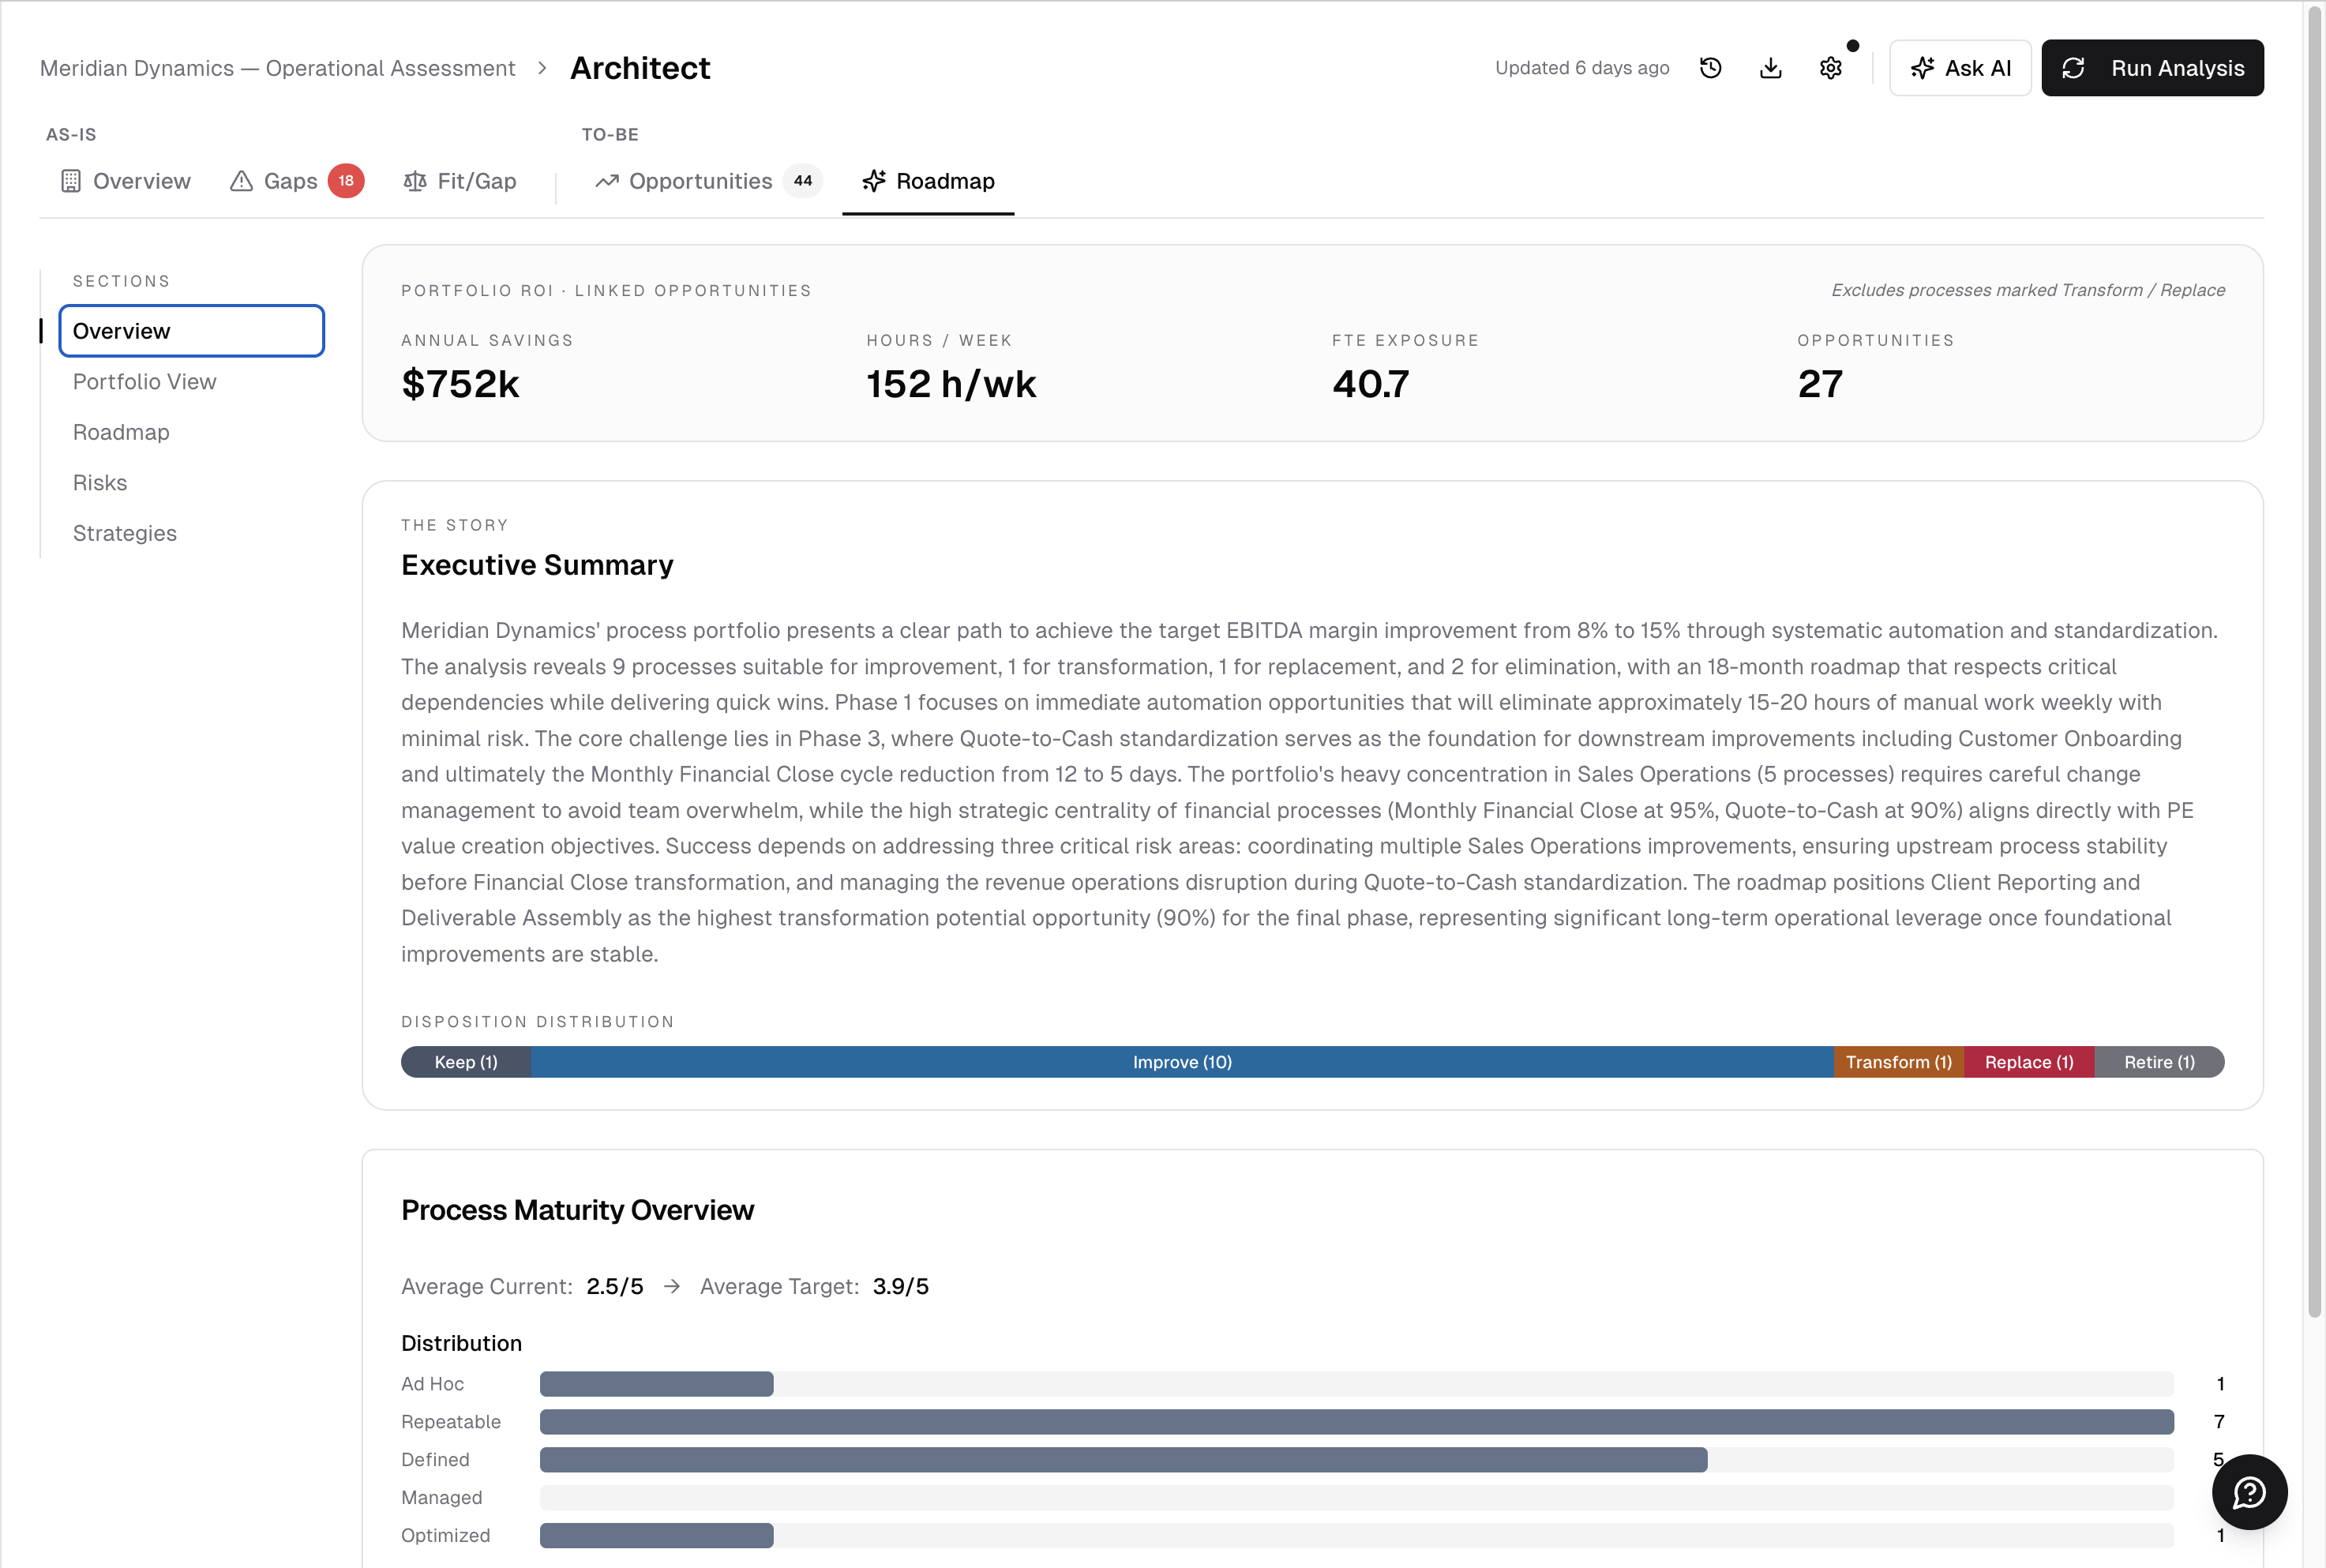
The overview shows portfolio-level metrics (annual savings, hours per week, FTE exposure, opportunity count), an executive summary with the AI's strategic narrative, a disposition distribution chart (Keep, Improve, Transform, Replace, Retire), and process maturity ratings.
Investment View
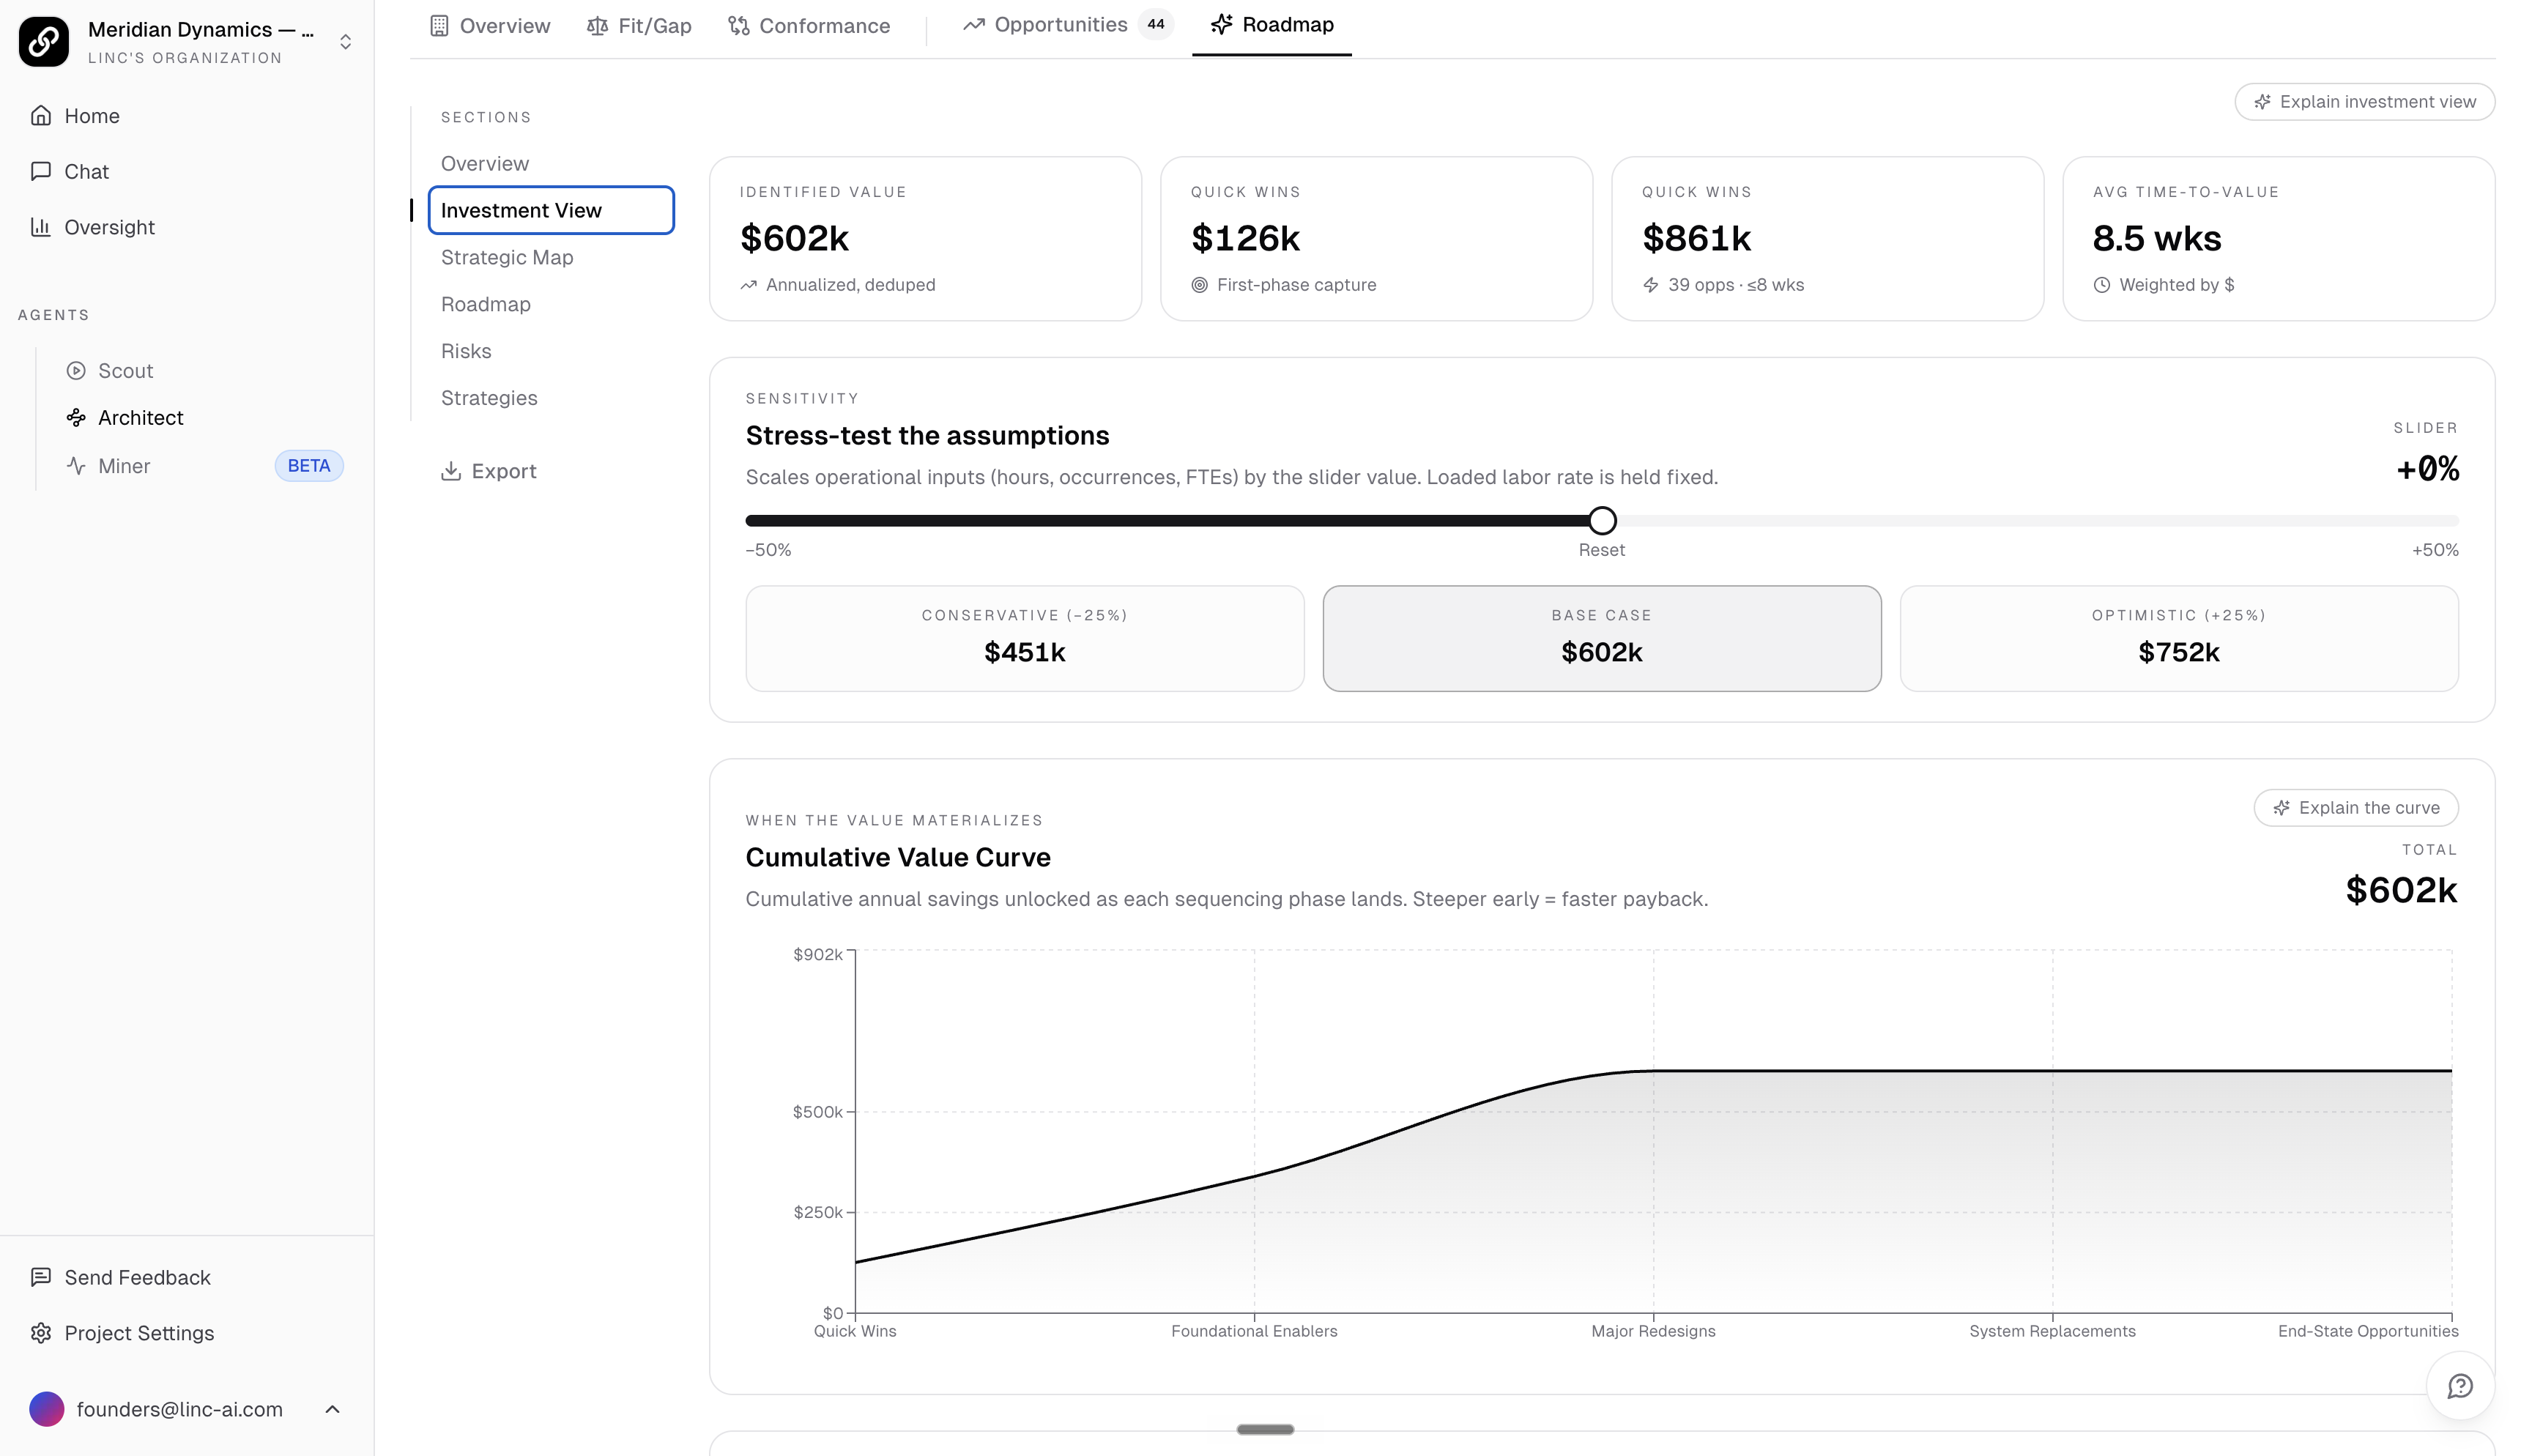
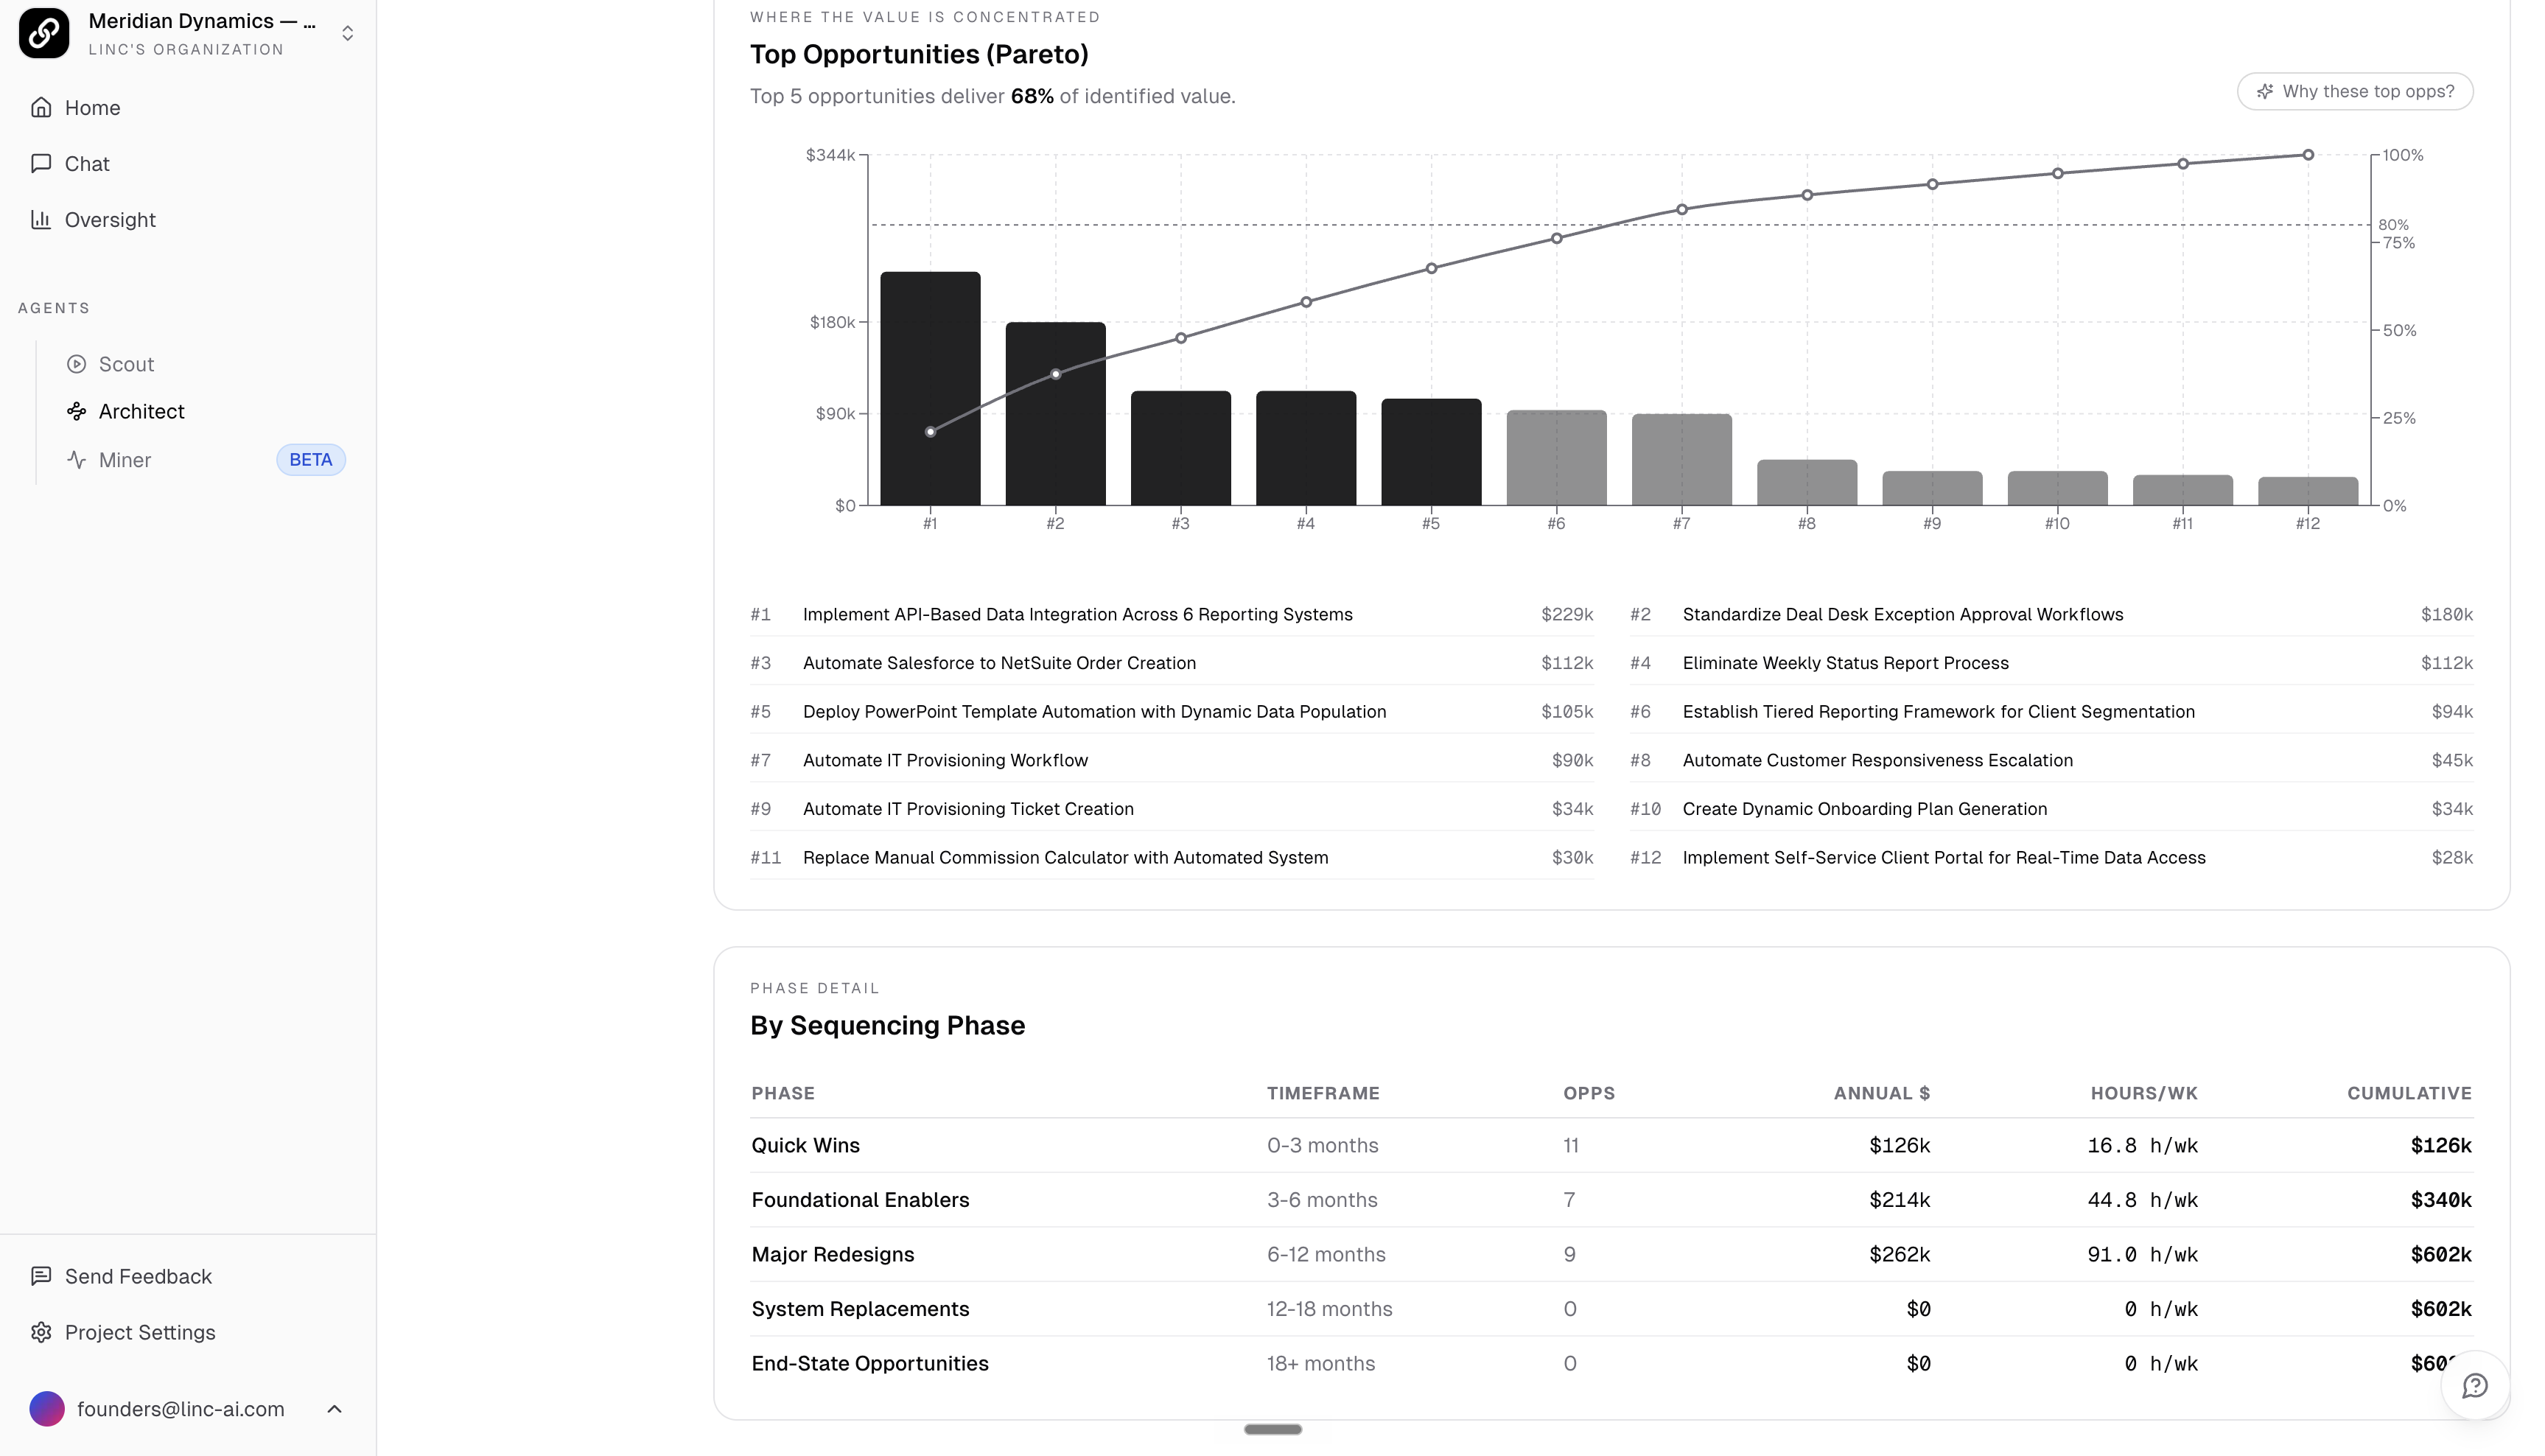
Investment View is a board-deck style section aimed at the questions a CFO asks. It includes a KPI strip, a cumulative-value curve showing when value materializes across the sequencing phases, a Pareto of the top opportunities by annual savings (showing where value is concentrated), a phase detail table, and a sensitivity slider that scales every input up or down so the model can be interrogated live in front of a skeptical audience. All math runs off the same ROI rollup the rest of the roadmap uses, so the numbers cannot drift.
Strategic Map
The Strategic Map (which replaced the older Portfolio View) is a scatter plot of opportunities color-coded by disposition. Select an axis pair to reframe the chart: Effort vs. Impact, Automation vs. Transformation, Centrality vs. Pain, Headcount vs. Risk, and more. Each axis pair carries its own quadrant labels (for example, Effort vs. Impact reads Quick Wins, Big Bets, Marginal, and Avoid) so the chart is readable without prior context.
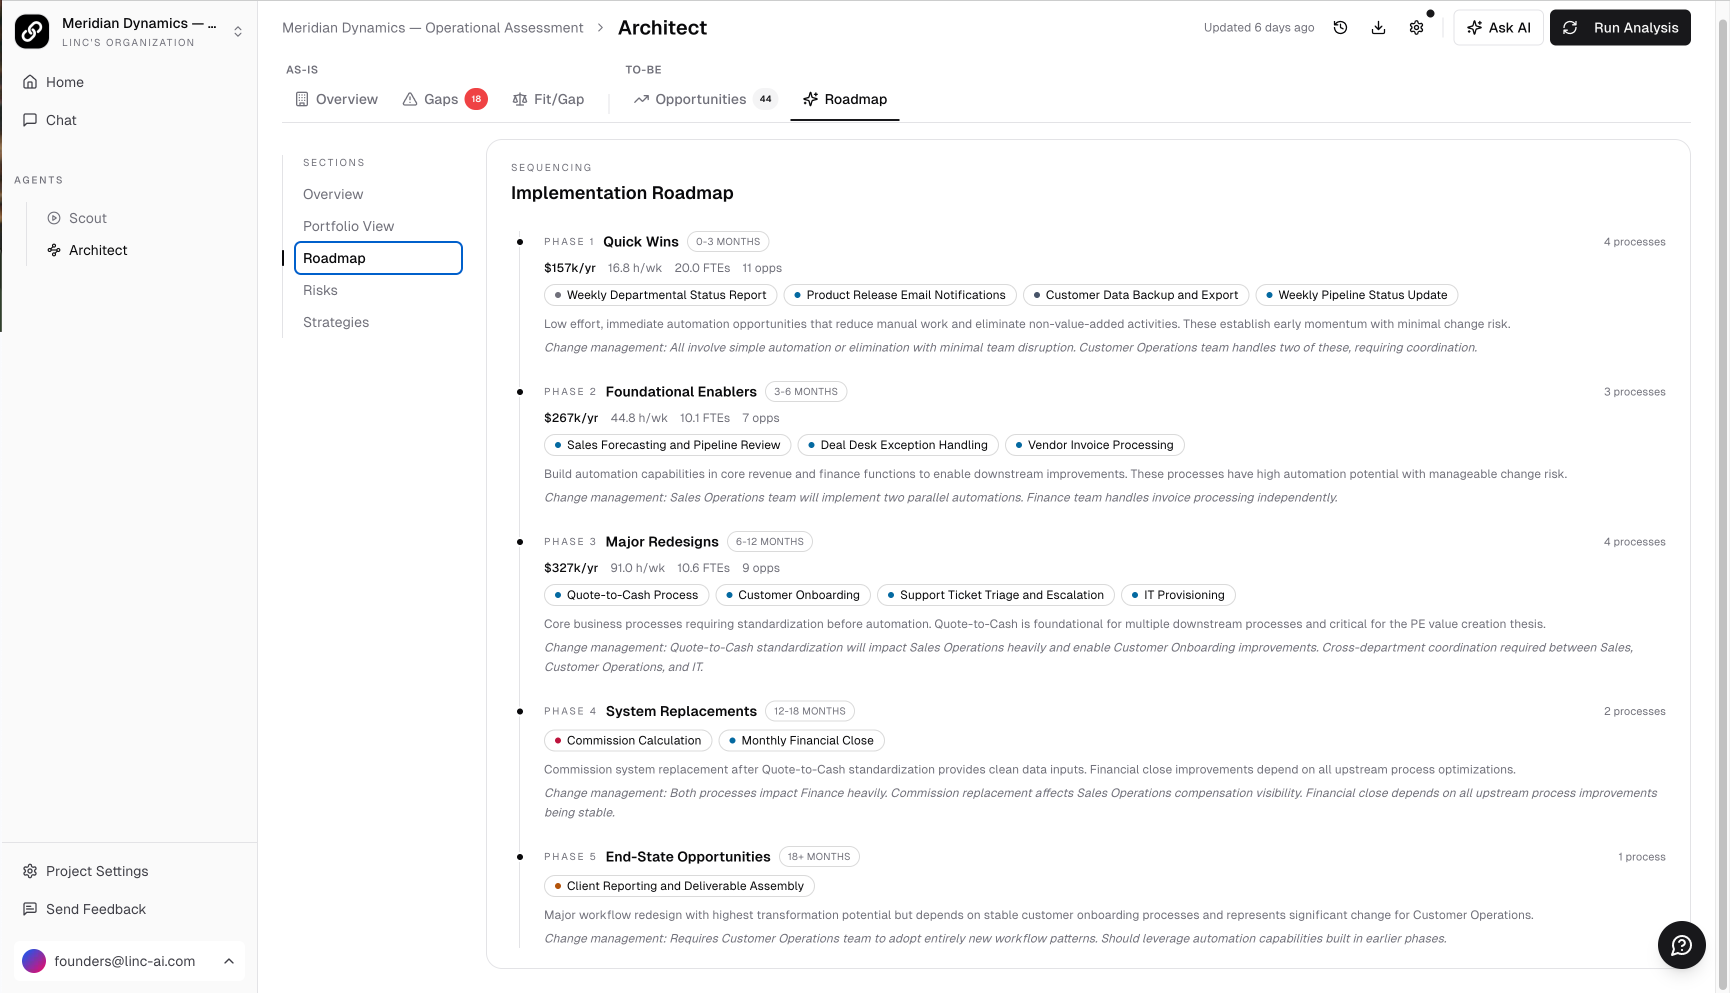
Implementation Roadmap
A sequenced, phased plan that groups processes into implementation tiers: Quick Wins, Foundational Enablers, Major Redesigns, System Replacements, and End-State Opportunities. Each phase shows ROI estimates and the processes involved.
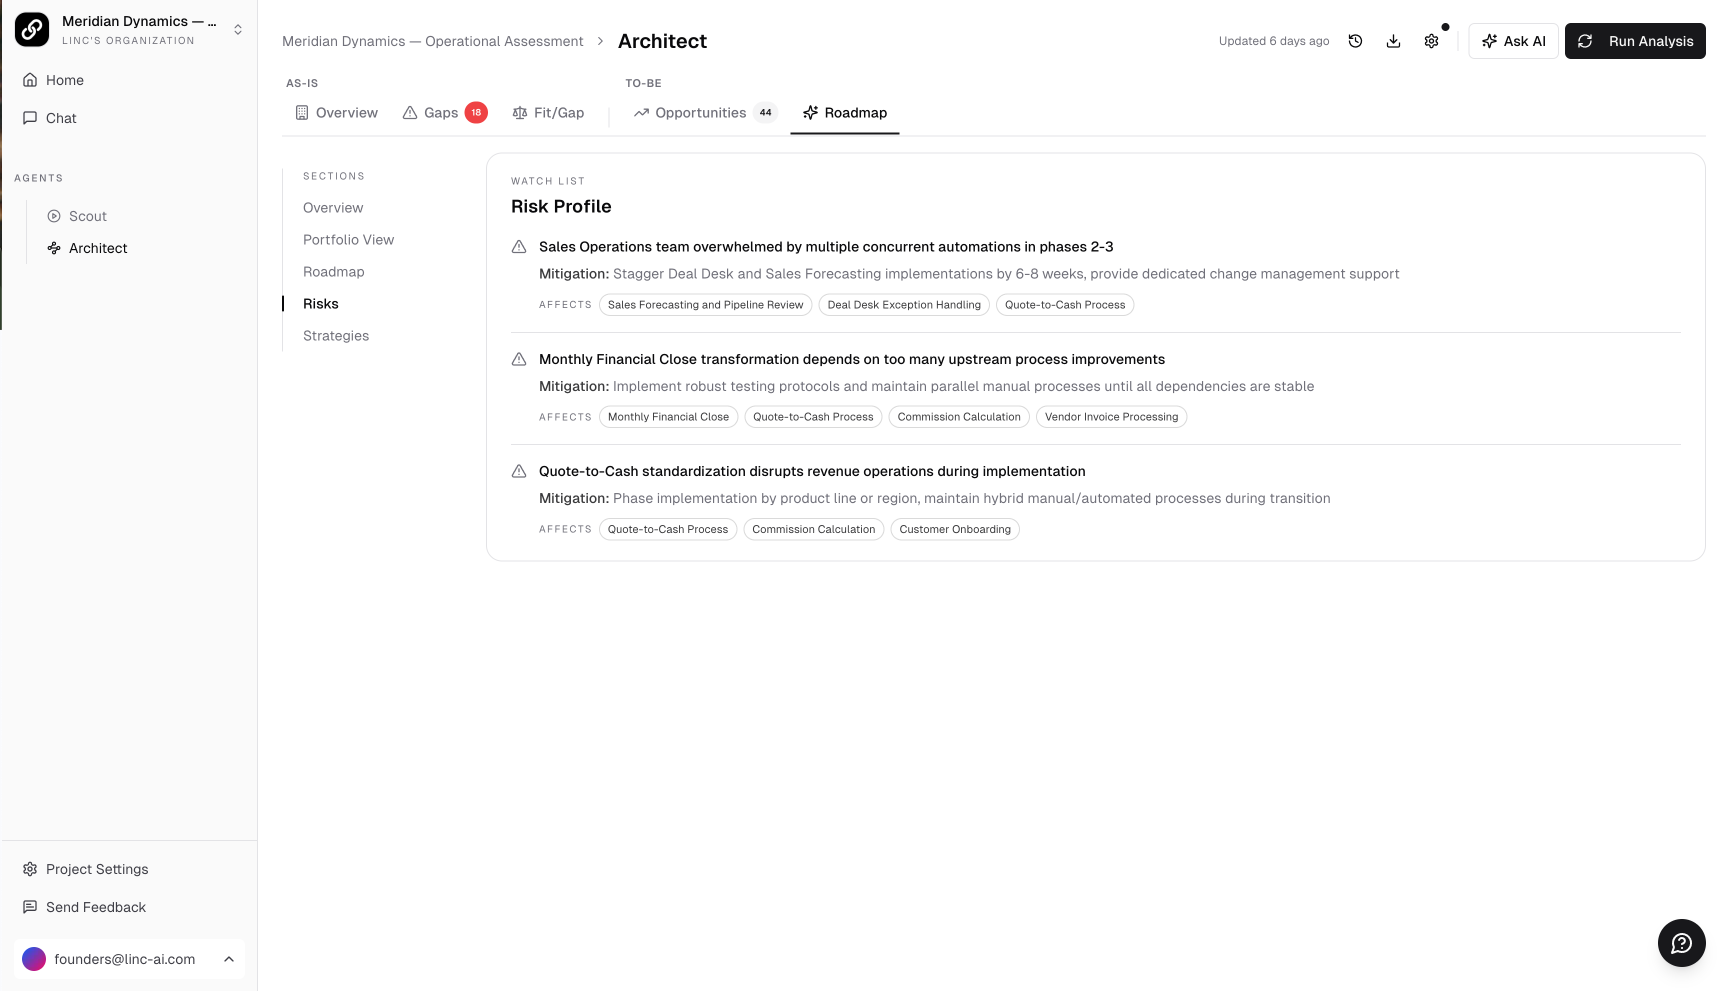
Risk Profile
A watch list of the top risks identified during the analysis. Each risk includes a mitigation strategy, the affected processes, and the implementation phases involved.
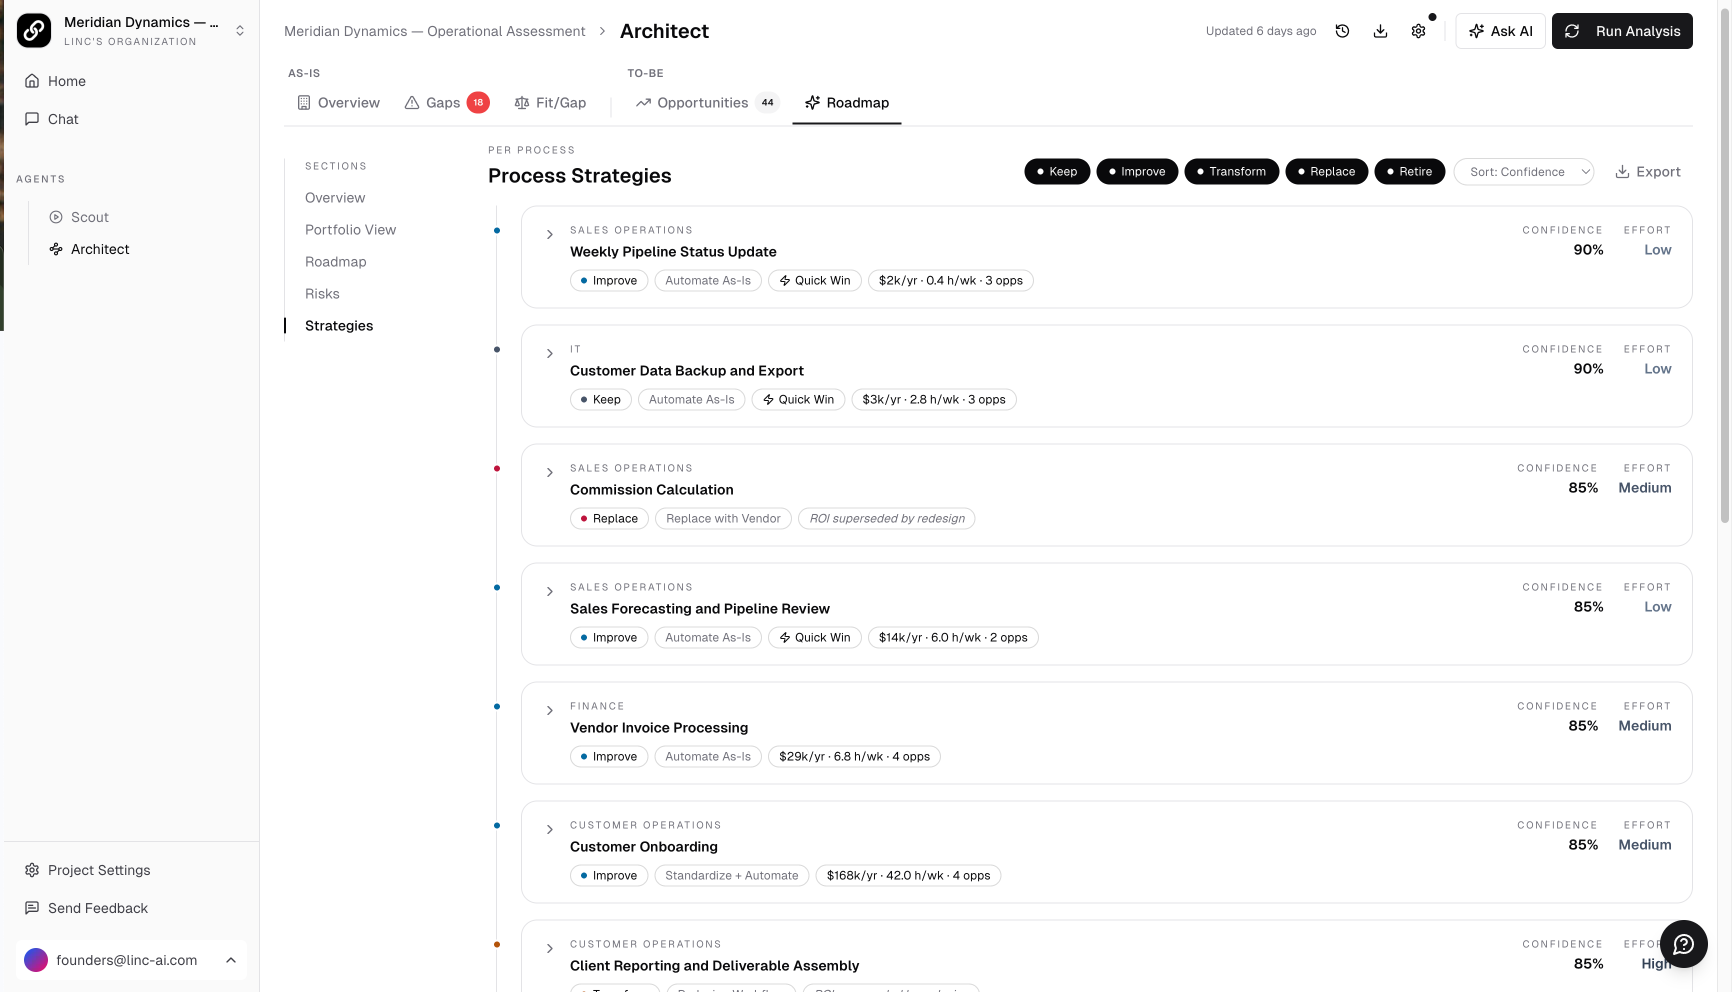
Process Strategies
A per-process breakdown showing the disposition (Keep, Improve, Transform, Replace, Retire), intervention type, confidence level, effort rating, and estimated ROI. Click any process to expand its detailed strategy card.
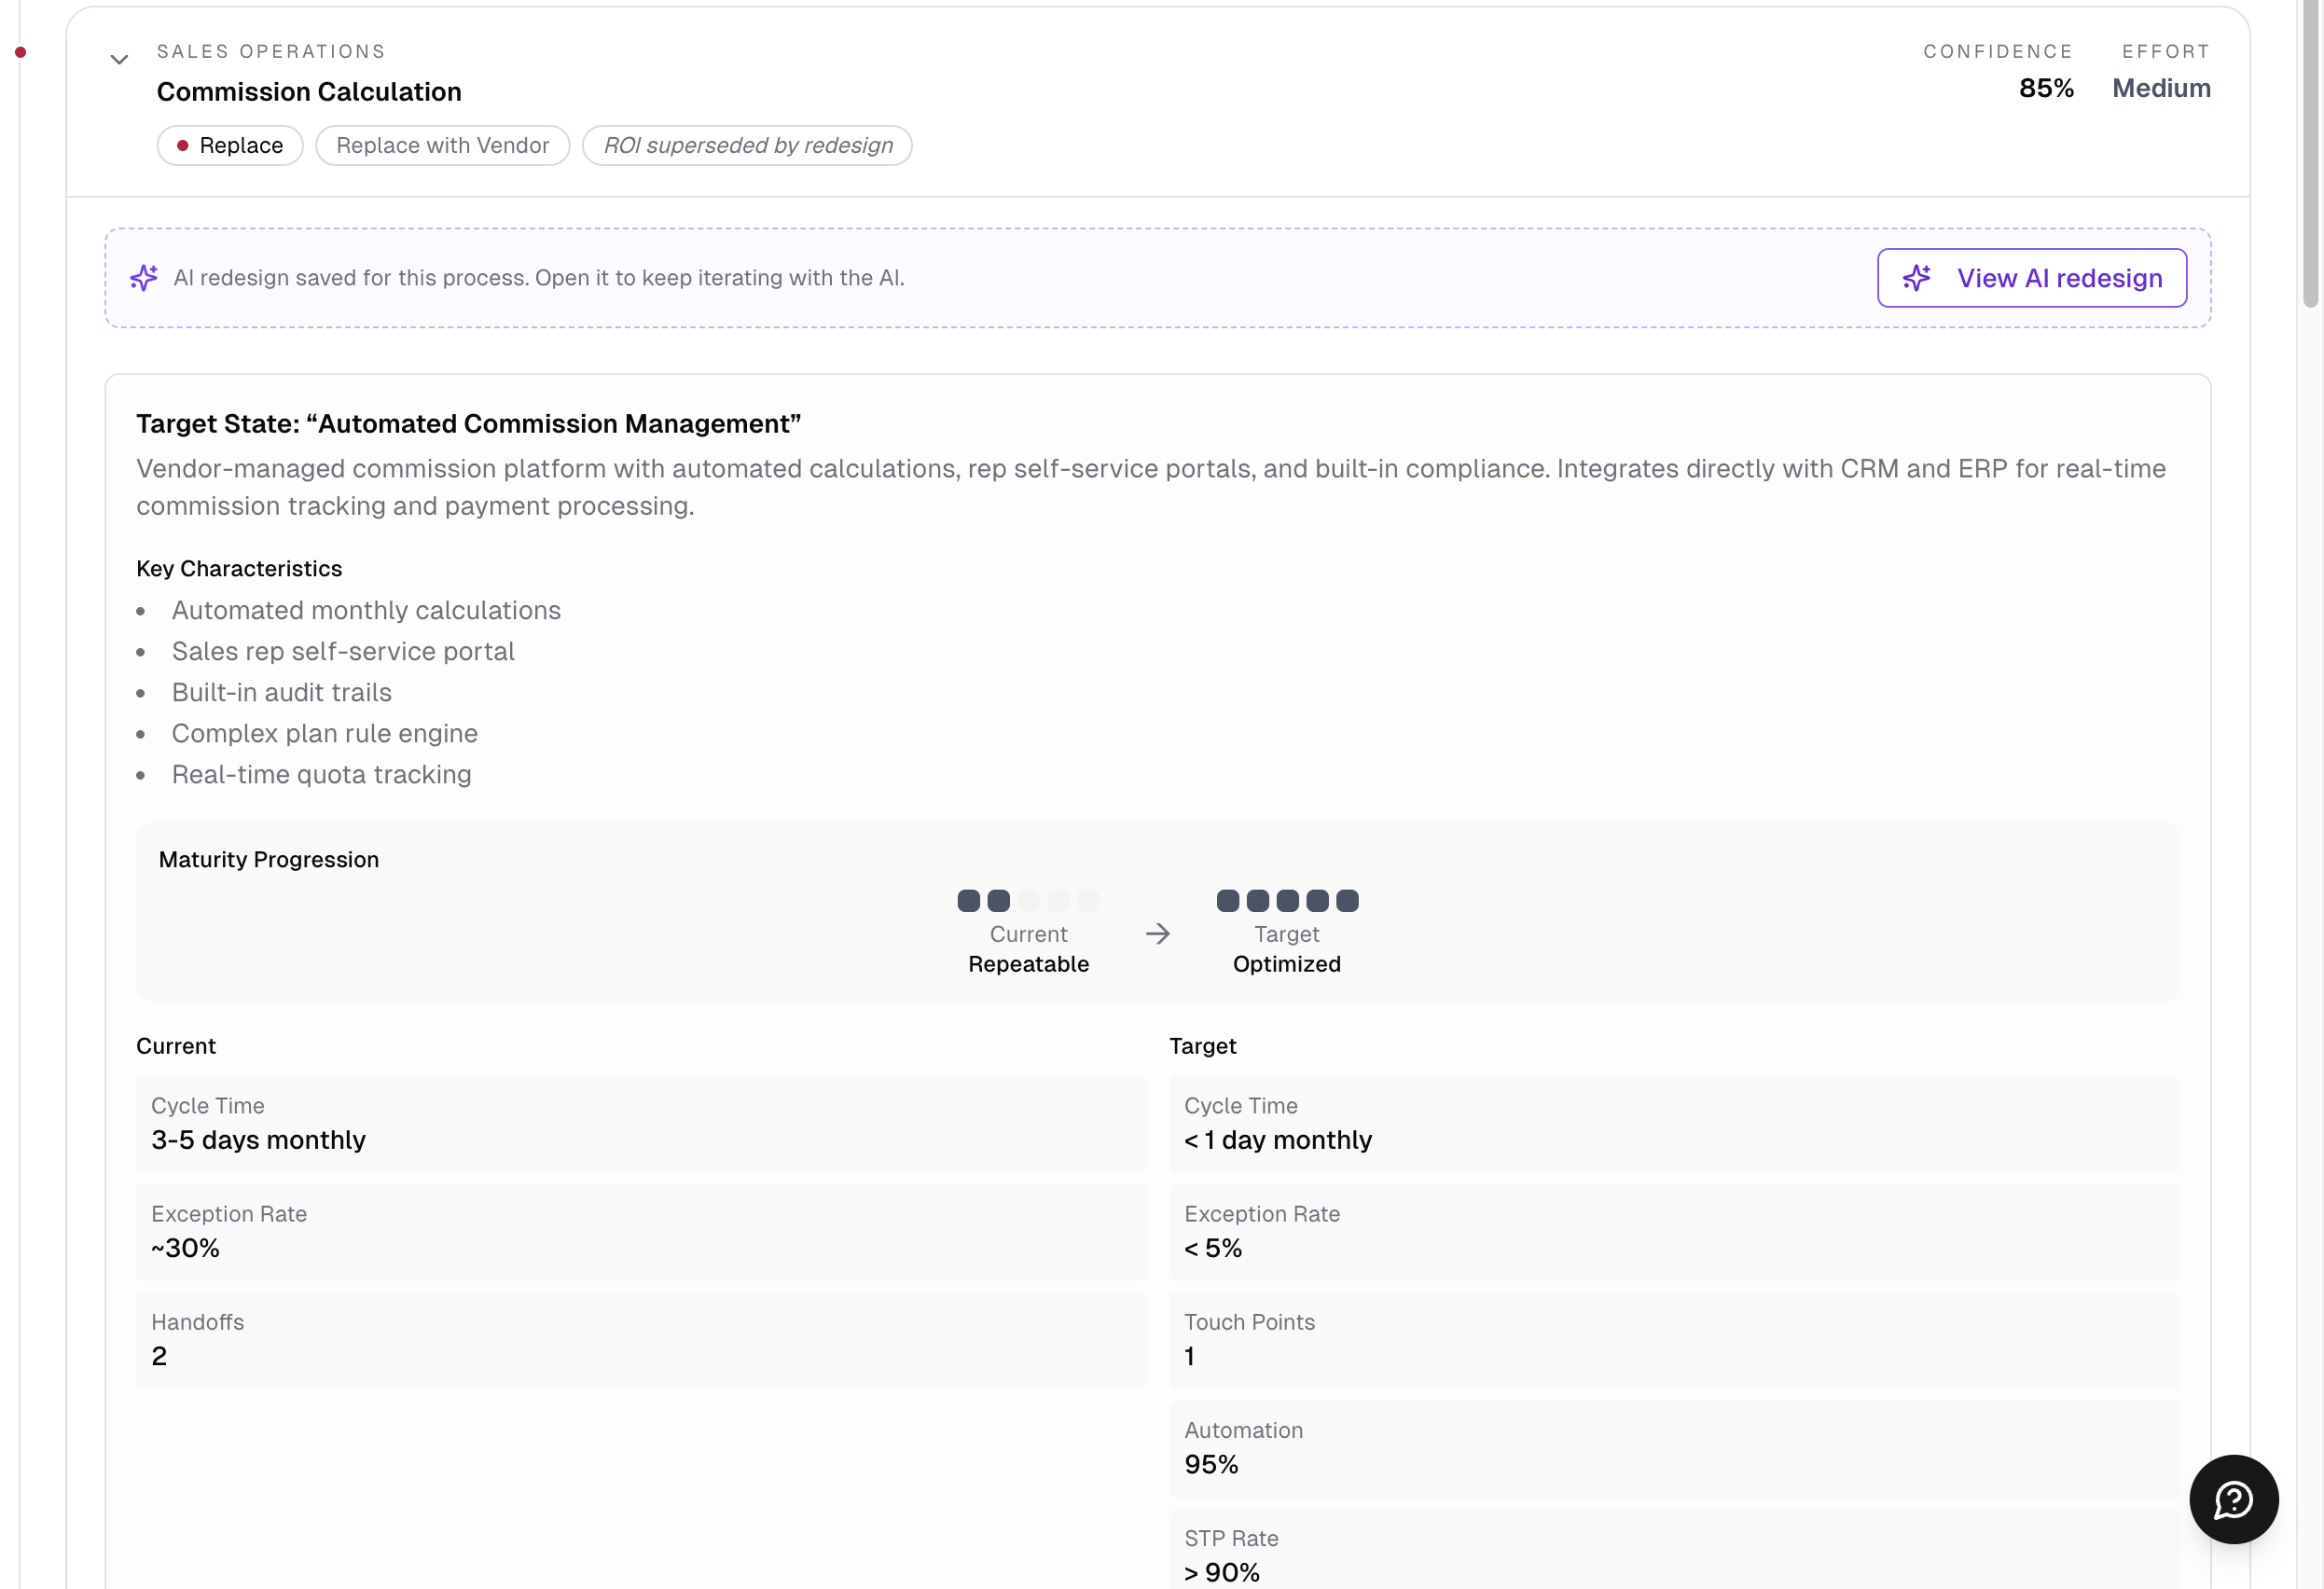
Each expanded strategy card includes the target state description, key characteristics, maturity progression (current vs. target), current and target metrics (cycle time, exception rate, handoffs, touch points, automation, STP rate), a transformation thesis, and confidence with evidence citations.
Use the Provide Feedback option to tell the AI what was missing or where to focus next. The feedback loop improves results on each subsequent analysis run.