Architect: Analyzing Processes
Map dependencies, identify gaps, compare variants, and surface improvement opportunities.
Architect synthesizes all documented workflows into a unified view, mapping dependencies across departments, identifying documentation gaps, and surfacing ranked improvement opportunities. Run Architect after your team has completed multiple Scout sessions.
Running an Analysis
Analysis Settings
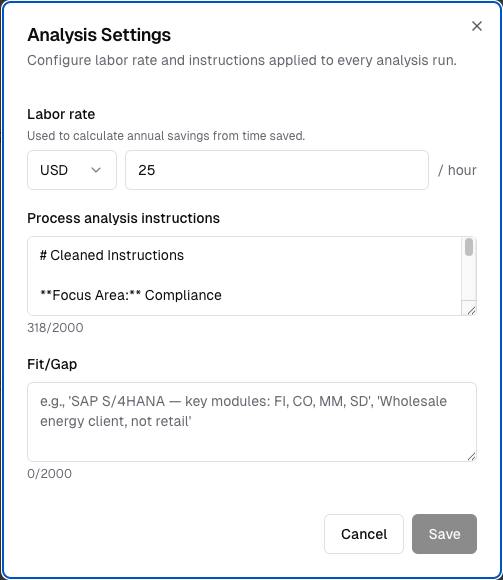
In the settings panel, you can configure:
- Labor rate - Used to calculate annual savings for each opportunity (e.g., $25/hour).
- Process analysis instructions - Natural language instructions to focus the analysis on specific areas, modules, or initiatives.
- Uploaded documents as evidence - Project documents you upload (existing SOPs, work instructions, procedure files) are treated as evidence alongside Scout sessions. Procedure-style documents are fed to the analyzer, while policy or off-topic files are skipped automatically.
After a run, each entry in the run history shows what it drew on (for example, "Analyzed 6 sessions and 3 documents"), so you can see exactly which evidence shaped the result. You can re-run the analysis at any time with updated settings. Choose "Build on previous analysis" to refine, or start fresh for a clean run.
Overview - Process Hierarchy
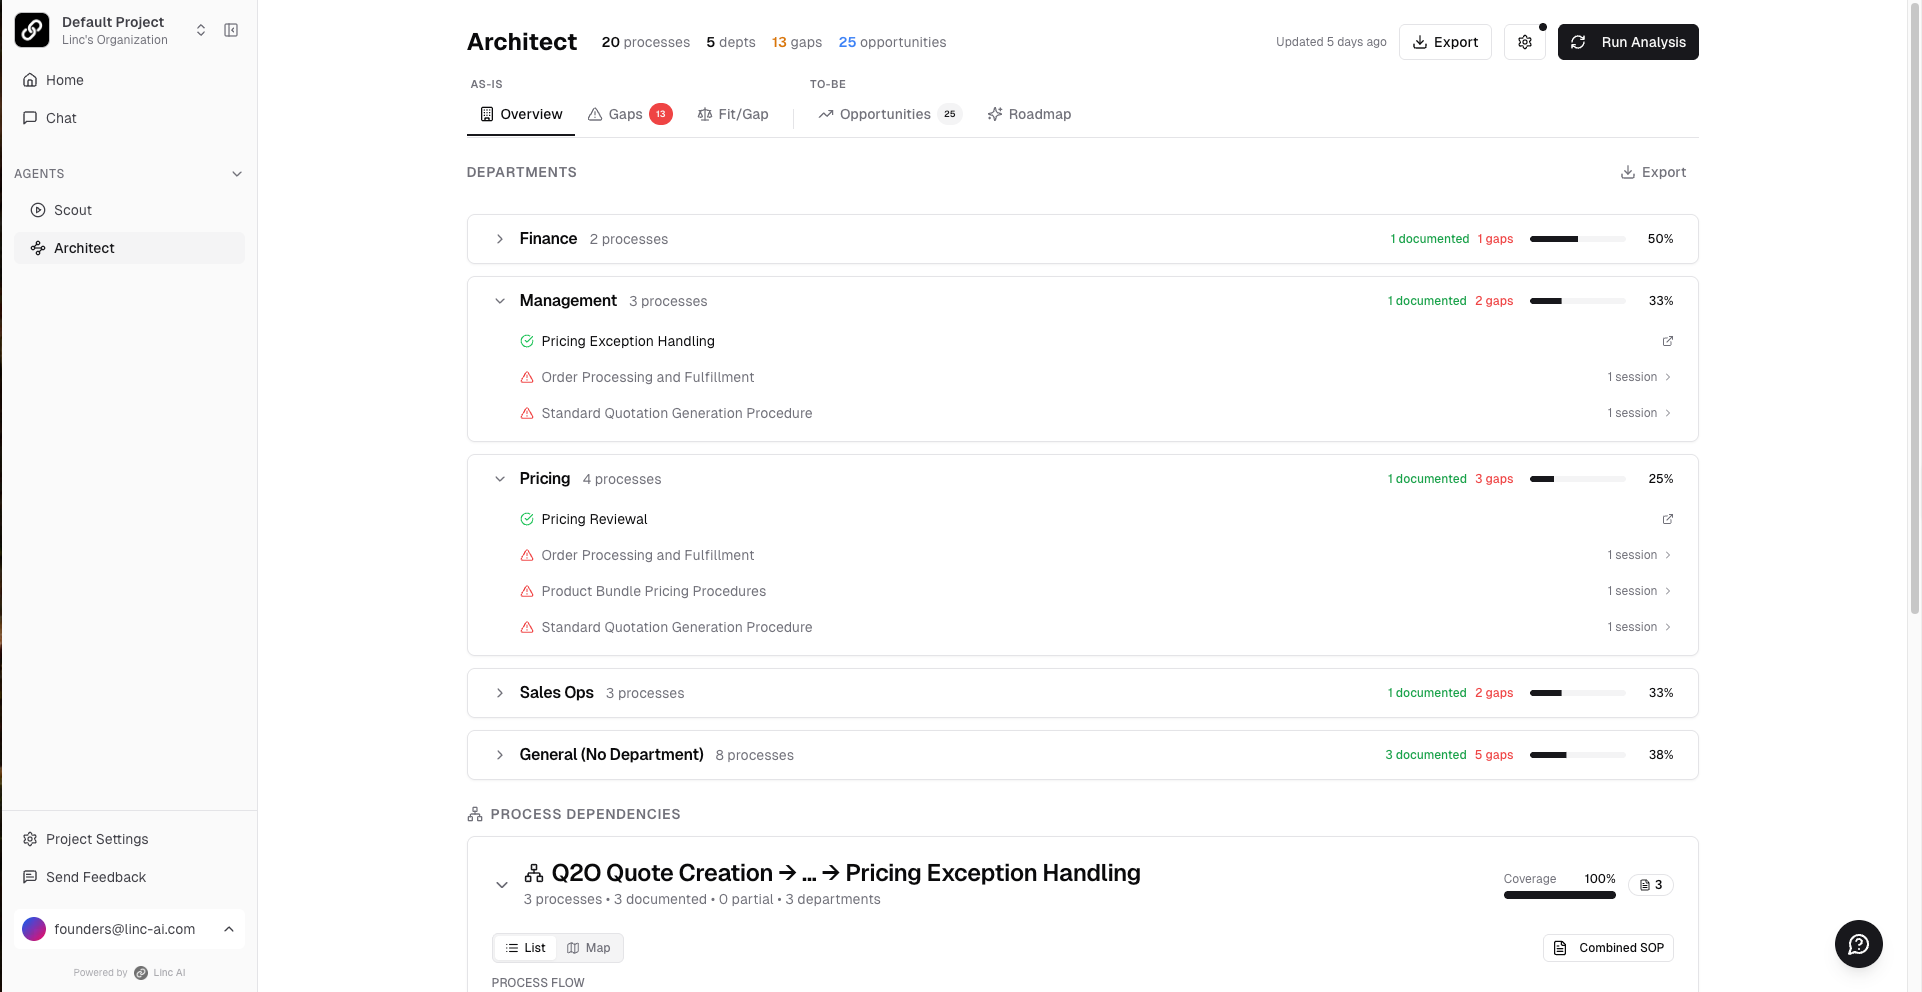
The default view organizes all discovered processes by department, showing documentation coverage, process counts, and identified gaps at a glance. Click any process to see its full details, linked SOPs, and dependencies.
The process table includes a Source date column showing when the underlying work was captured. A process documented on a single day shows that date; one captured across several sessions shows the date span, so you can tell at a glance how recent (and how consistent) the evidence behind each process is.
Process Variants
Different people, sites, or teams often run the same process in different ways. Architect can detect and compare these variants so you can see exactly where they diverge and converge.
Switch the process list to the Variant lens to group processes into auto-detected variant groups. Use Detect Variants on the variant lens header to (re)run detection, then select between 2 and 8 processes that are variants of one another and choose Compare Variants.
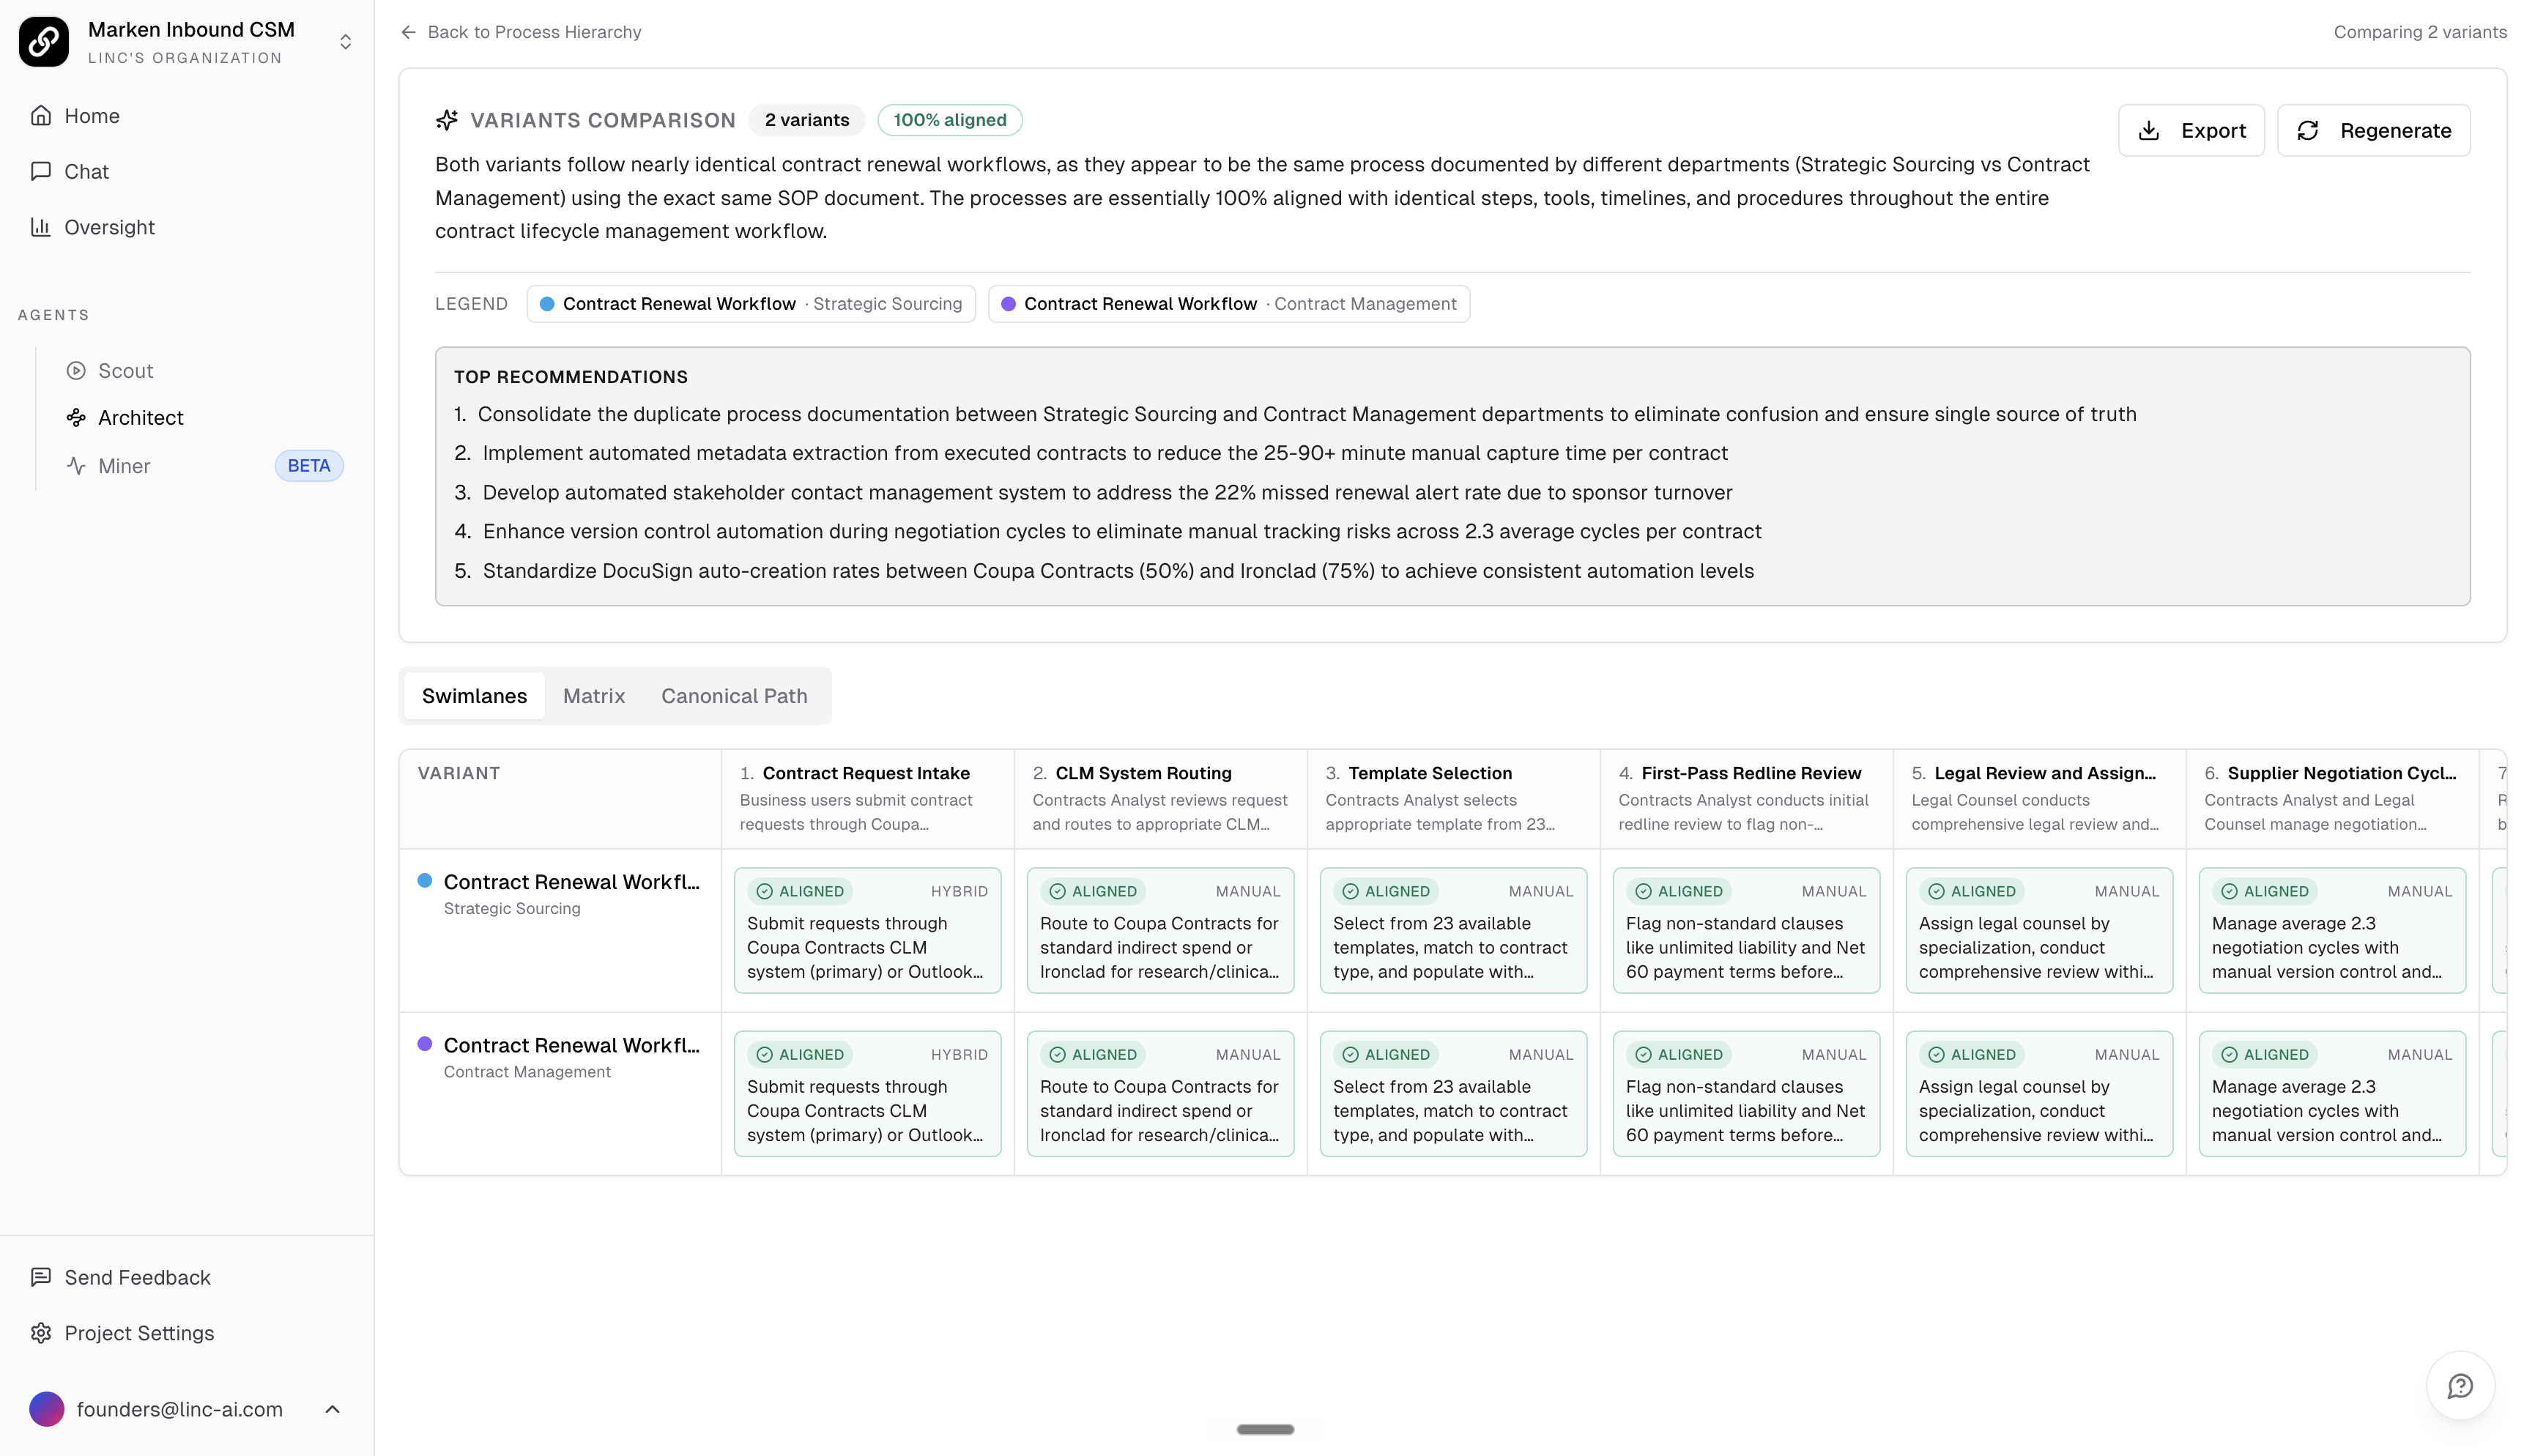
The comparison view presents an overall alignment score plus three tabs:
- Swimlanes - One row per variant with columns aligned to a shared set of canonical steps. Each cell is color-coded as aligned, variant, missing, or extra, so you can scan a single step down the column to see how every variant handles it.
- Matrix - A compact table summarizing each step across all variants, with a recommendation per step. Good for an executive summary or export.
- Canonical Path - A synthesized best-of happy path with per-step recommendations, plus each variant's unique strengths and notable gaps.
Use Regenerate to refresh the comparison and Export to download it.
Gap Analysis
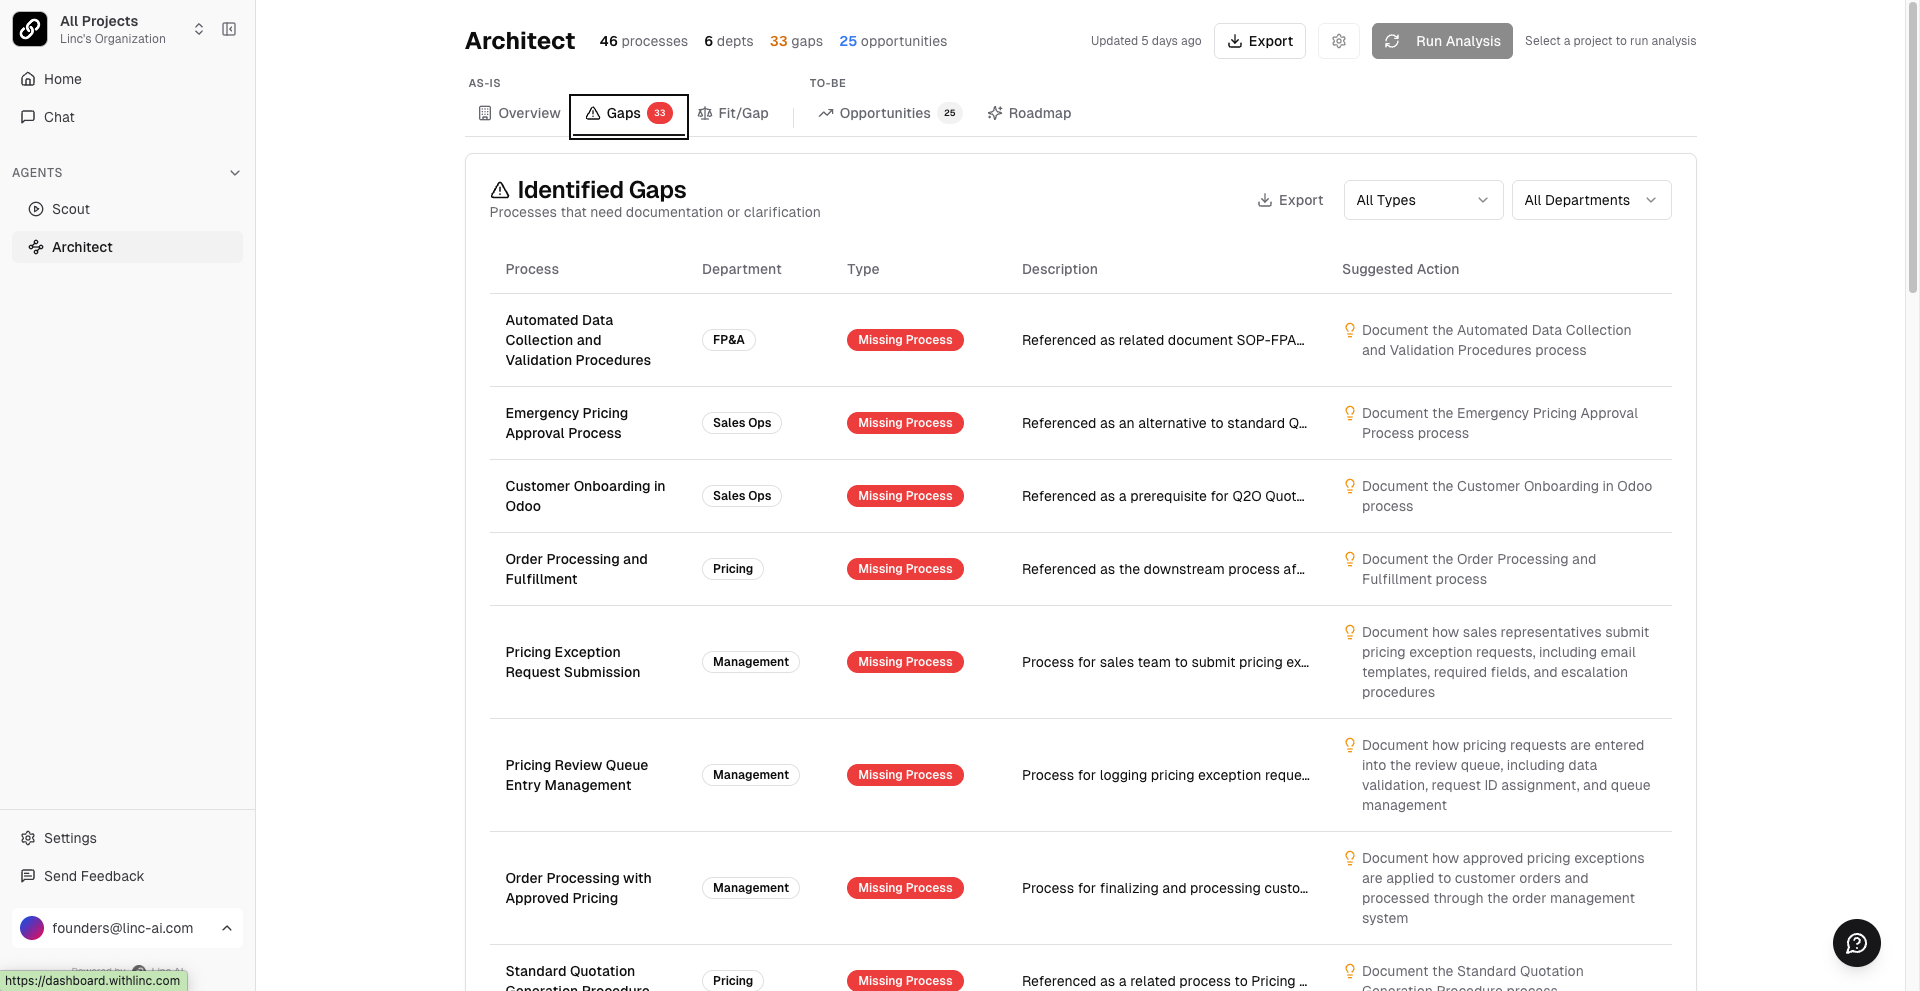
The Gap Analysis tab highlights processes that were referenced during interviews but lack their own documentation. Each gap includes a description, affected department, and a suggested action to close it. This ensures no critical process falls through the cracks.
Process Chains
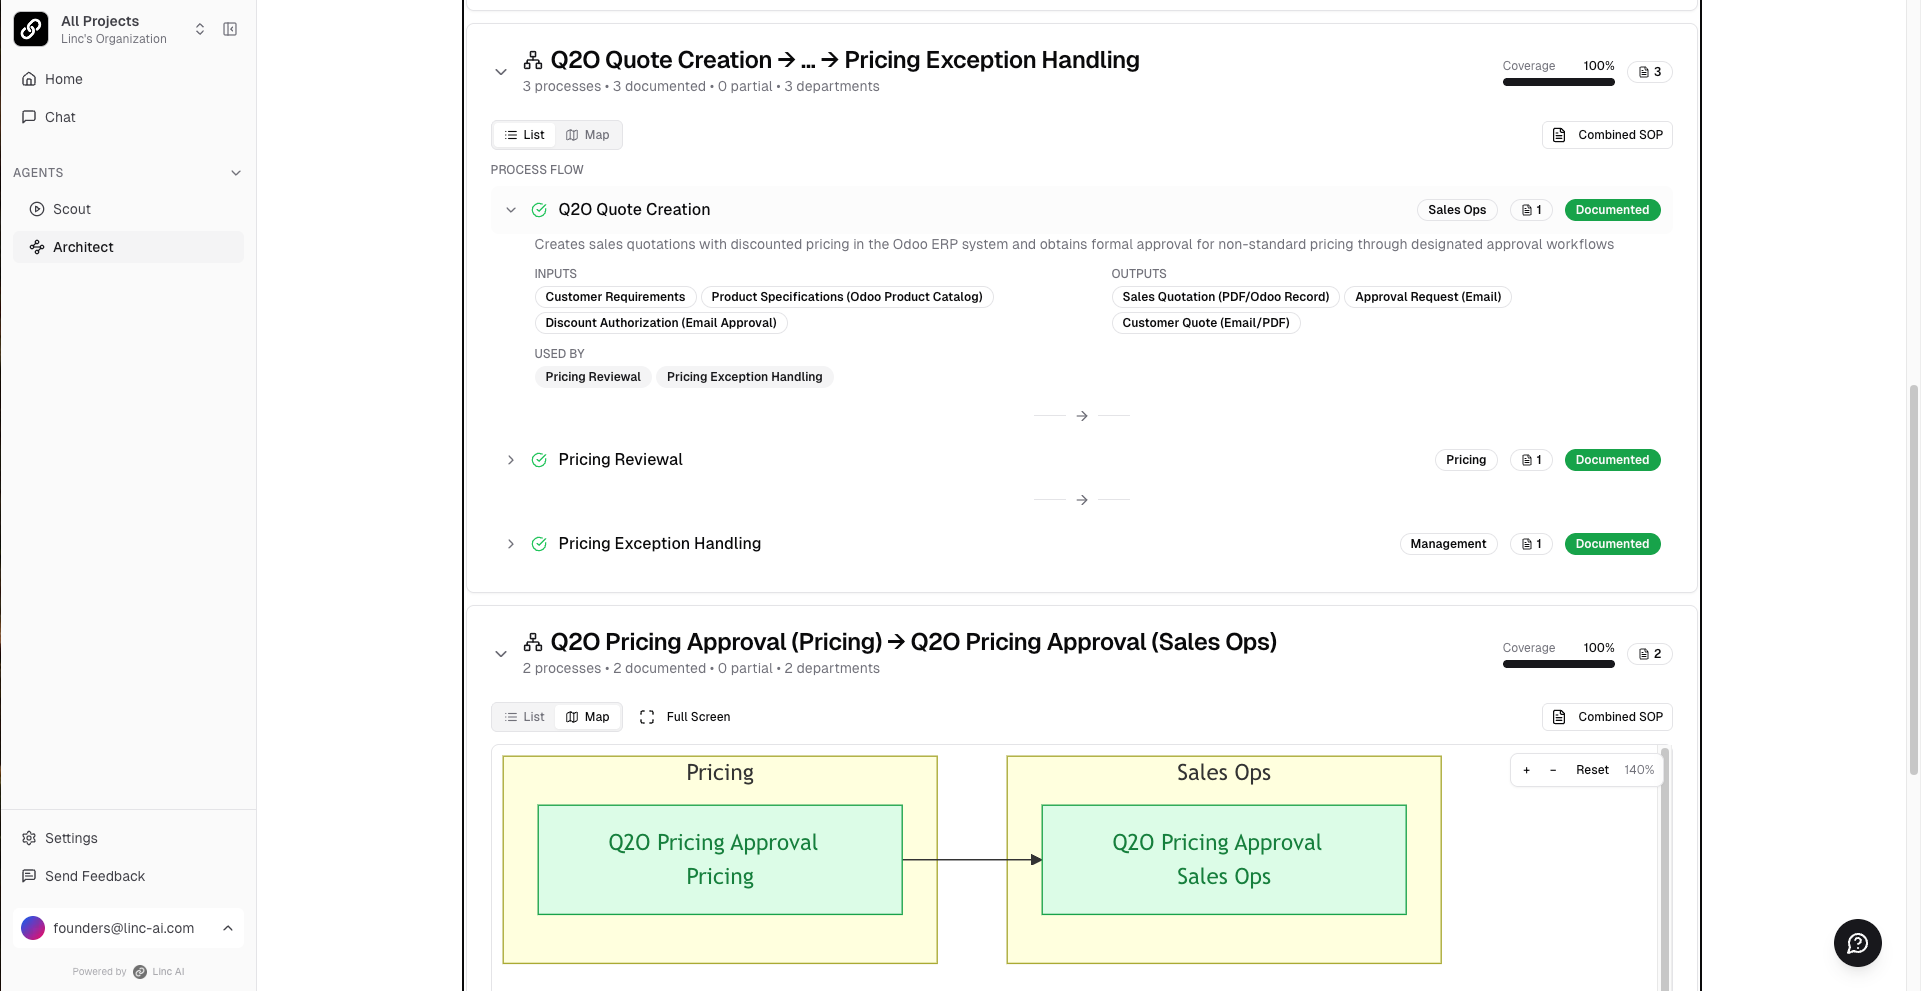
The Process Chains view maps end-to-end workflows that span multiple departments, revealing how processes hand off between teams. This is essential for identifying bottlenecks and automation opportunities at handoff points. You can generate a Combined SOP for any process chain to get a single end-to-end document.
Analysis Chat
Architect includes a chat docked alongside the analysis where you can query the captured process data in plain language (ask about a specific process, department, gap, or how teams differ). You can also open it from a process with Ask AI about this item to seed the conversation with that context.
A per-user Beta toggle in the chat header switches the engine. The default chat is tuned for refining the analysis and its generated content. The Beta engine is a sandbox-backed agent that goes a step further: it stages generated SOPs, diagrams, summaries, and other artifacts (charts, spreadsheets, and reports grounded in this run) into a chat workspace. Delivered artifacts appear in a files rail beside the conversation, where you can preview and export them.
Exporting Architect Data
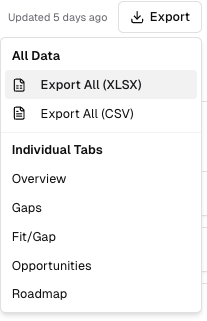
All Architect outputs - overview, gaps, opportunities, roadmap, and fit/gap results - can be exported to Excel or CSV using the Export button in the top-right corner. Export all data at once or individual tabs. Variant comparisons can be exported on their own from the comparison view, and artifacts produced in the Beta analysis chat export individually from the files rail.